Technical Analysis of LEN 2024-05-10
Overview:
In analyzing the technical indicators for Lennar Corporation (LEN) over the last 5 days, we will delve into the trend, momentum, volatility, and volume indicators to provide a comprehensive outlook on the possible stock price movement in the coming days. By examining these key aspects, we aim to offer valuable insights and predictions for potential investors and traders.
Trend Analysis:
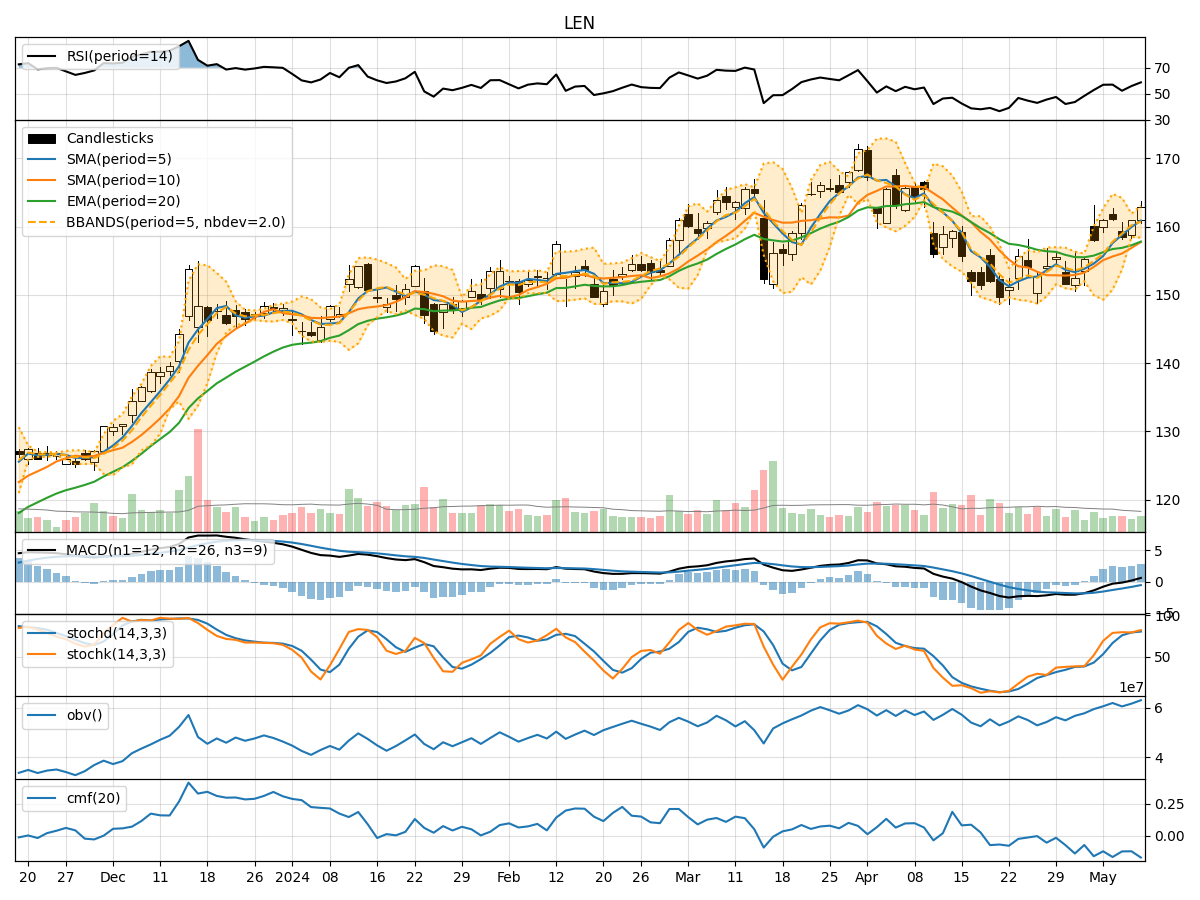
- Moving Averages (MA): The 5-day Moving Average (MA) has been consistently above the Simple Moving Average (SMA) and Exponential Moving Average (EMA), indicating a bullish trend.
- MACD: The Moving Average Convergence Divergence (MACD) has shown positive values, with the MACD line consistently above the Signal line, suggesting bullish momentum.
- Conclusion: The trend indicators point towards an upward trajectory for LEN.
Momentum Analysis:
- RSI: The Relative Strength Index (RSI) has been fluctuating around the 50 level, indicating a neutral momentum.
- Stochastic Oscillator: Both %K and %D have been in the overbought zone, suggesting a potential reversal.
- Conclusion: The momentum indicators signal a neutral to slightly bearish sentiment for LEN.
Volatility Analysis:
- Bollinger Bands: The stock price has mostly remained within the Bollinger Bands, with the bands narrowing, indicating decreasing volatility.
- Conclusion: Volatility indicators suggest a consolidation phase for LEN.
Volume Analysis:
- On-Balance Volume (OBV): The OBV has shown mixed movements, indicating indecision among market participants.
- Chaikin Money Flow (CMF): The CMF has been negative, reflecting selling pressure.
- Conclusion: Volume indicators imply a lack of strong buying interest in LEN.
Overall Conclusion:
Based on the analysis of trend, momentum, volatility, and volume indicators, the next few days' possible stock price movement for LEN is likely to be sideways with a slight bearish bias. While the trend indicators suggest an upward trajectory, the momentum and volume indicators point towards a neutral to bearish sentiment. The volatility indicators indicate a consolidation phase, further supporting the sideways movement outlook.
Investors should closely monitor key support and resistance levels, as well as any significant developments in the broader market that could impact LEN's price movement. It is advisable to exercise caution and consider a balanced approach while making trading decisions in the current market environment.