Technical Analysis of LNC 2024-05-10
Overview:
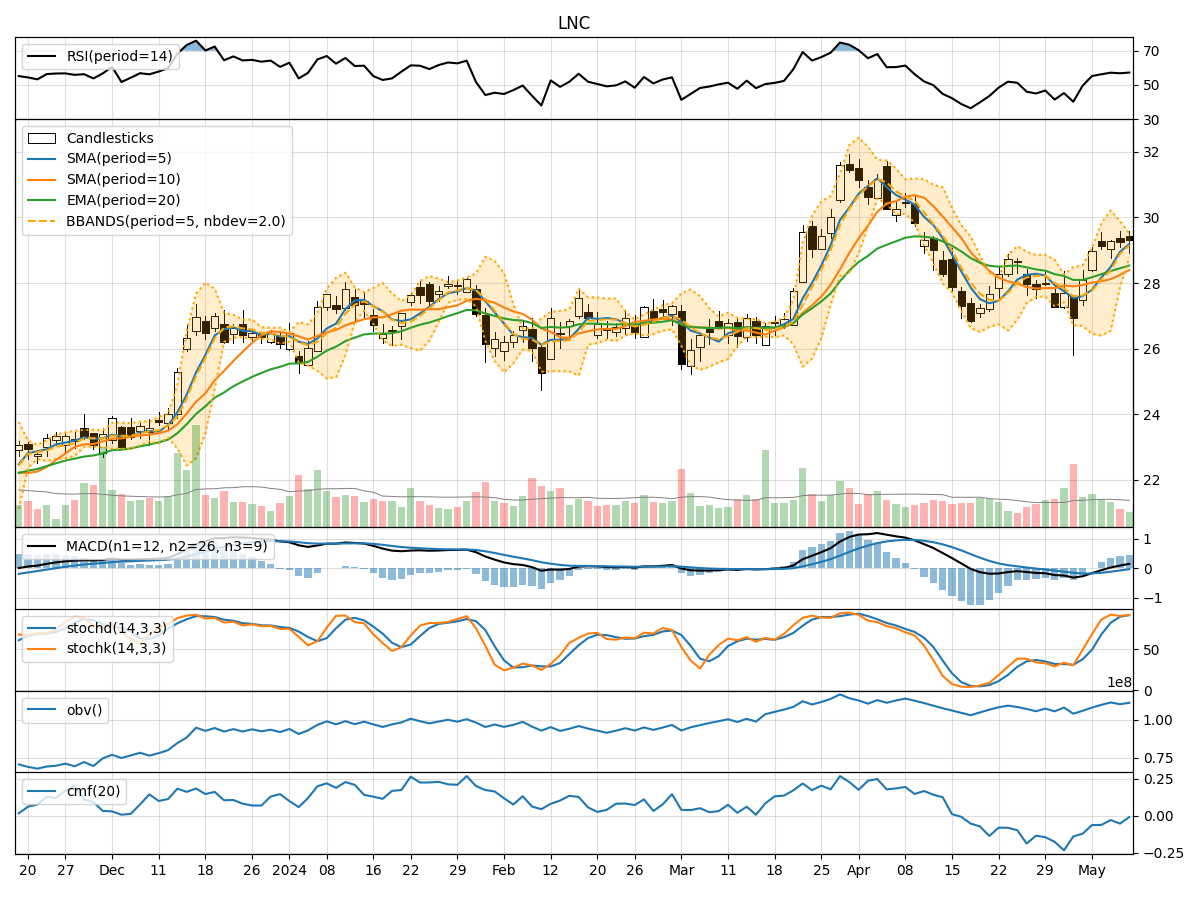
In analyzing the technical indicators for LNC over the last 5 days, we will delve into the trend, momentum, volatility, and volume indicators to provide a comprehensive outlook on the possible stock price movement. By examining these key indicators, we aim to offer valuable insights and predictions for the upcoming days.
Trend Analysis:
- Moving Averages (MA): The 5-day Moving Average has been consistently rising, indicating a bullish trend in the short term.
- MACD: The MACD line has been above the signal line for the past few days, suggesting a bullish momentum.
- EMA: The Exponential Moving Average has also been trending upwards, supporting the bullish sentiment.
Momentum Analysis:
- RSI: The Relative Strength Index has been hovering around the mid-level, indicating a neutral momentum.
- Stochastic Oscillator: Both %K and %D have been in the overbought territory, suggesting a potential reversal or consolidation.
- Williams %R: The Williams %R is also in the oversold region, signaling a possible reversal.
Volatility Analysis:
- Bollinger Bands: The stock price has been trading within the Bollinger Bands, with the bands narrowing, indicating decreasing volatility.
- Bollinger %B: The %B indicator is around 0.7, suggesting the stock is trading closer to the upper band.
Volume Analysis:
- On-Balance Volume (OBV): The OBV has been fluctuating but has not shown a clear trend, indicating mixed sentiment among investors.
- Chaikin Money Flow (CMF): The CMF has been negative, suggesting outflow of money from the stock.
Key Observations:
- The trend indicators point towards a bullish sentiment in the short term.
- Momentum indicators show a mixed picture with potential signs of a reversal.
- Volatility has been decreasing, indicating a possible period of consolidation.
- Volume indicators reflect uncertainty and lack of strong buying or selling pressure.
Conclusion:
Based on the analysis of the technical indicators, the next few days for LNC could see sideways movement with a slight bullish bias. Traders should watch for potential reversals indicated by the Stochastic Oscillator and Williams %R, while also monitoring the OBV for any significant shifts in buying or selling pressure. Overall, caution is advised in trading LNC in the upcoming days due to the mixed signals from the indicators.