Technical Analysis of LW 2024-05-10
Overview:
In analyzing the technical indicators for LW stock over the last 5 days, we will delve into the trend, momentum, volatility, and volume indicators to provide a comprehensive outlook on the possible stock price movement in the coming days. By examining these key indicators, we aim to offer valuable insights and predictions for potential investors.
Trend Analysis:
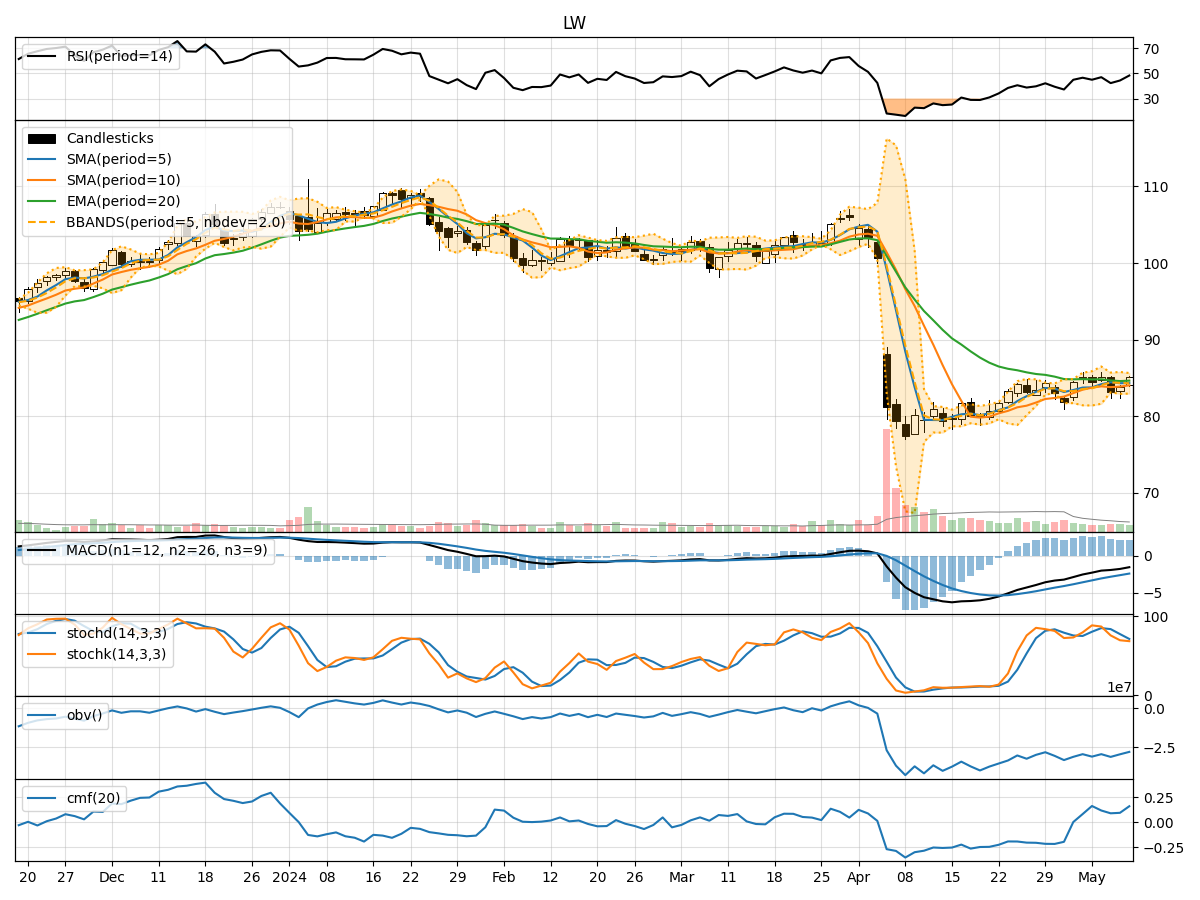
- Moving Averages (MA): The 5-day MA has been fluctuating around the closing prices, indicating short-term price trends. The SMA(10) and EMA(20) show a slight decline, suggesting a weakening trend.
- MACD: The MACD has been negative, with the MACD line below the signal line, indicating bearish momentum.
- MACD Histogram: The MACD histogram has been decreasing, signaling a potential decrease in bearish momentum.
Momentum Analysis:
- RSI: The RSI has been hovering around the mid-range, indicating a neutral momentum.
- Stochastic Oscillator: Both %K and %D have been declining, suggesting a bearish momentum.
- Williams %R: The Williams %R is in the oversold territory, indicating a potential reversal.
Volatility Analysis:
- Bollinger Bands (BB): The stock price has been trading within the bands, with the %B indicating a neutral position.
- Average True Range (ATR): The ATR has been relatively stable, suggesting consistent volatility levels.
Volume Analysis:
- On-Balance Volume (OBV): The OBV has been declining, indicating selling pressure in the stock.
- Chaikin Money Flow (CMF): The CMF has been positive but decreasing, suggesting a weakening buying pressure.
Key Observations:
- The trend indicators show a weakening trend with bearish signals from the MACD.
- Momentum indicators indicate a neutral to bearish momentum, with potential for a reversal based on Williams %R.
- Volatility remains relatively stable, with the stock price trading within the Bollinger Bands.
- Volume indicators suggest selling pressure, as seen in the declining OBV.
Conclusion:
Based on the analysis of the technical indicators, the outlook for LW stock in the next few days is bearish. The weakening trend, bearish momentum signals, and selling pressure indicated by volume indicators point towards a potential downward movement in the stock price. Traders and investors should exercise caution and consider short-term selling or adopting a wait-and-see approach until clearer bullish signals emerge.