Technical Analysis of LXFR 2024-05-10
Overview:
In analyzing the technical indicators for LXFR over the last 5 days, we will delve into the trend, momentum, volatility, and volume indicators to provide a comprehensive assessment of the stock's potential price movement. By examining these key factors, we aim to offer valuable insights and predictions for the next few days.
Trend Analysis:
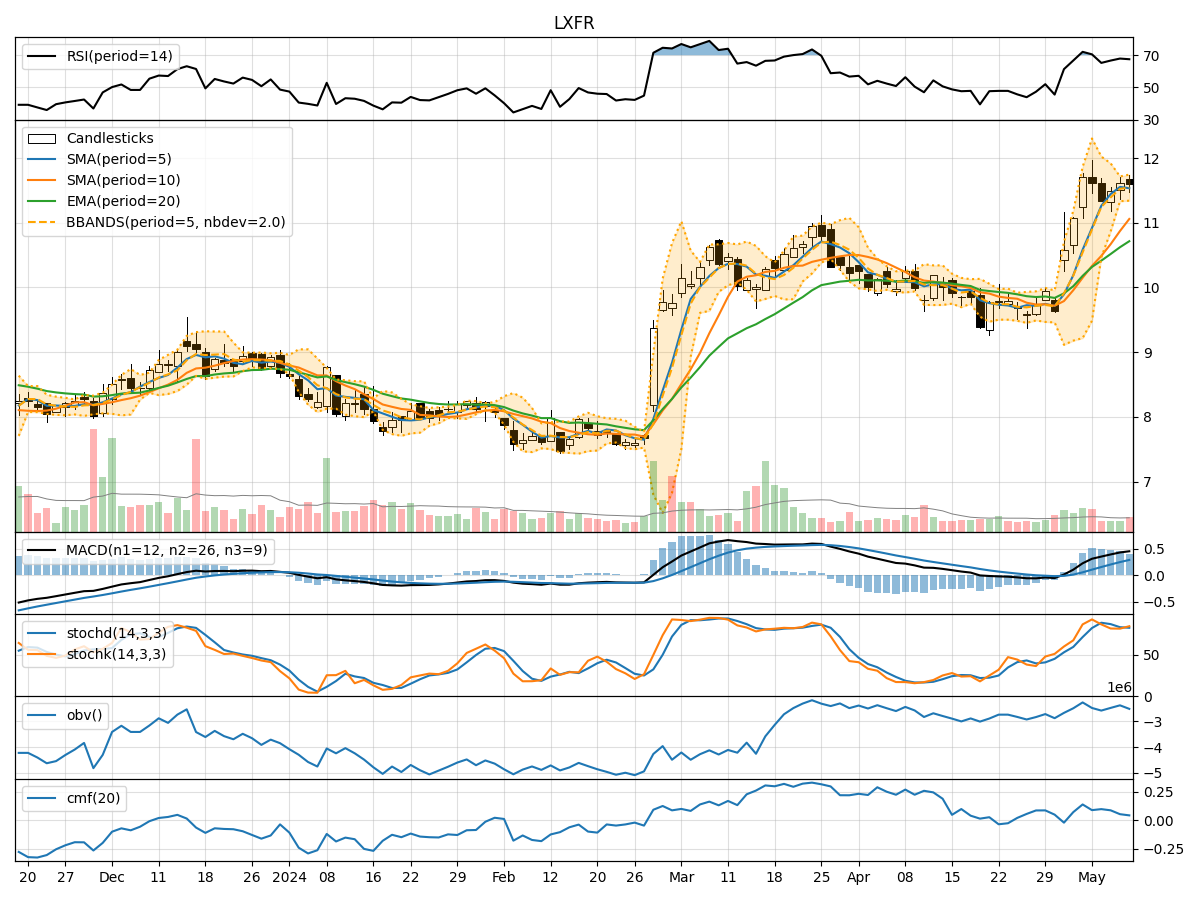
- Moving Averages (MA): The 5-day Moving Average (MA) has been consistently above the Simple Moving Average (SMA) and Exponential Moving Average (EMA), indicating a bullish trend.
- MACD: The MACD line has been above the signal line, with both lines showing an upward trend, suggesting bullish momentum.
Momentum Analysis:
- RSI: The Relative Strength Index (RSI) has been fluctuating around 70, indicating a neutral to slightly overbought condition.
- Stochastic Oscillator: Both %K and %D have been in the overbought zone, suggesting a potential reversal or consolidation.
Volatility Analysis:
- Bollinger Bands (BB): The stock price has been trading within the bands, with the %B indicator hovering around 0.5, indicating a balanced volatility.
Volume Analysis:
- On-Balance Volume (OBV): The OBV has shown a slight increase over the last 5 days, indicating some accumulation by investors.
- Chaikin Money Flow (CMF): The CMF has been positive but decreasing, suggesting a potential weakening of buying pressure.
Key Observations:
- The trend indicators point towards a bullish sentiment, supported by the moving averages and MACD.
- Momentum indicators show a mixed signal with RSI indicating a neutral stance and Stochastic Oscillator hinting at a possible reversal.
- Volatility remains relatively stable within the Bollinger Bands, indicating a lack of significant price fluctuations.
- Volume indicators suggest some accumulation but with a decrease in buying pressure as indicated by CMF.
Conclusion:
Based on the analysis of the technical indicators, the stock price of LXFR is likely to experience further upward movement in the next few days. The bullish trend supported by moving averages and MACD, along with stable volatility within the Bollinger Bands, indicates a positive outlook. However, caution is advised due to the mixed signals from momentum indicators, particularly the overbought conditions highlighted by the Stochastic Oscillator. Investors should closely monitor price action and volume dynamics for any signs of a potential reversal or consolidation in the near term.