Technical Analysis of M 2024-05-10
Overview:
In analyzing the provided Technical Analysis (TA) data for the last 5 days, we will delve into the trend, momentum, volatility, and volume indicators to forecast the possible stock price movement for the next few days. By examining these key indicators, we aim to provide a comprehensive and insightful prediction backed by data-driven analysis.
Trend Indicators:
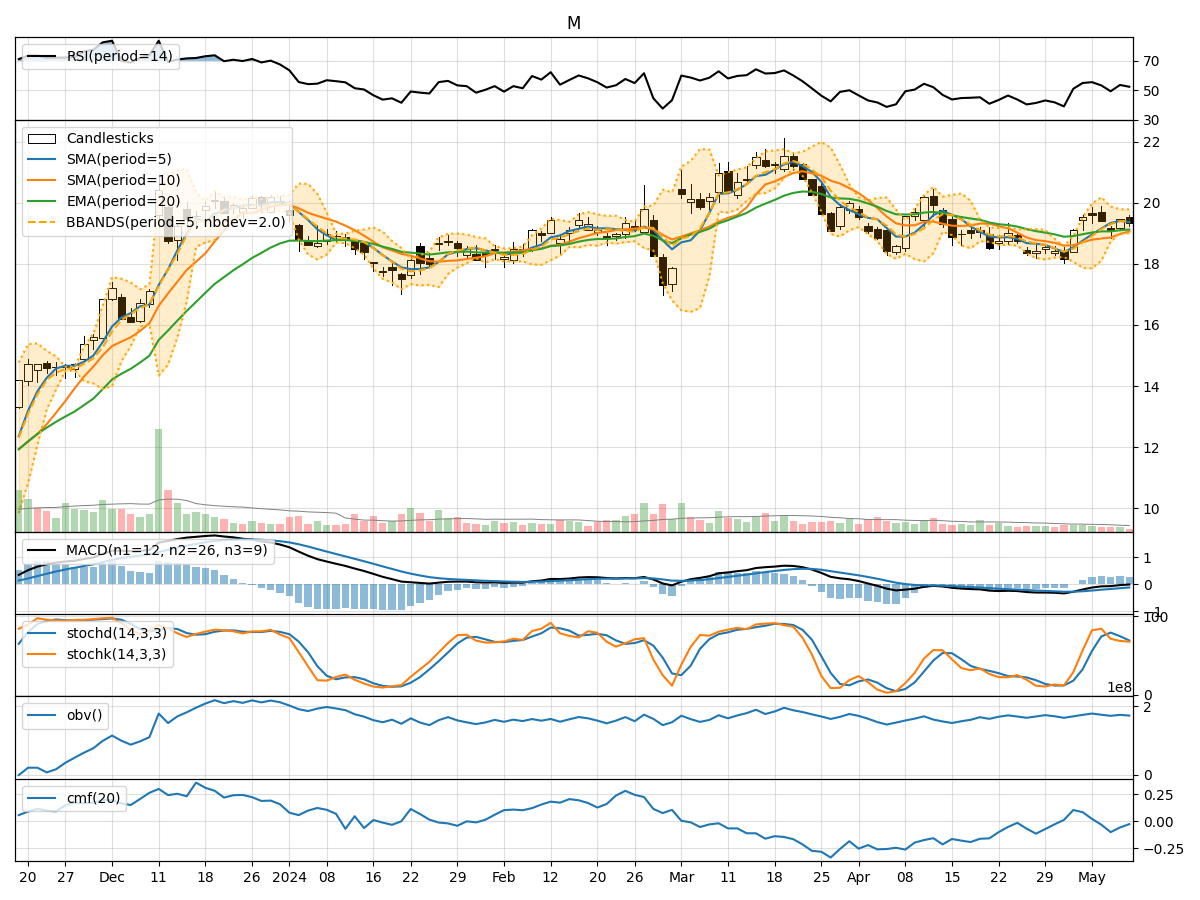
- Moving Averages (MA): The 5-day Moving Average (MA) has been consistently above the closing prices, indicating a potential bullish trend.
- MACD: The Moving Average Convergence Divergence (MACD) has shown a decreasing trend in the MACD line, suggesting a possible weakening of the bullish momentum.
- RSI: The Relative Strength Index (RSI) has fluctuated around the neutral zone, indicating a lack of strong directional bias.
Momentum Indicators:
- Stochastic Oscillator: The Stochastic Oscillator has been fluctuating within the overbought and oversold levels, suggesting a mixed momentum in the stock.
- Williams %R: The Williams %R indicator has shown oscillations around the oversold territory, indicating potential buying opportunities.
Volatility Indicators:
- Bollinger Bands: The Bollinger Bands have shown narrowing bands, indicating decreasing volatility and a potential period of consolidation.
- Average True Range (ATR): The ATR has shown a decrease in volatility, suggesting a possible stabilization in price movements.
Volume Indicators:
- On-Balance Volume (OBV): The OBV indicator has shown mixed volume accumulation, indicating indecision among market participants.
- Chaikin Money Flow (CMF): The CMF has been negative, suggesting a lack of buying pressure in the stock.
Key Observations and Opinions:
- Trend: The trend indicators suggest a potential continuation of the bullish trend, albeit with some signs of weakening momentum.
- Momentum: The momentum indicators indicate a mixed sentiment with oscillations in overbought and oversold levels, reflecting uncertainty in the market.
- Volatility: Volatility indicators point towards a period of consolidation and stabilization in price movements.
- Volume: Volume indicators show indecision among investors, with a lack of significant buying pressure.
Conclusion:
Based on the analysis of the technical indicators, the stock is likely to experience sideways movement in the next few days. The bullish trend may continue, but with a potential slowdown in momentum. Traders should exercise caution and closely monitor key support and resistance levels for potential entry or exit points. It is advisable to wait for clearer signals or confirmation from the indicators before making significant trading decisions.