Technical Analysis of MA 2024-05-10
Overview:
In analyzing the provided Moving Average (MA) Technical Analysis (TA) data for the last 5 days, we will delve into various technical indicators across trend, momentum, volatility, and volume to forecast the possible stock price movement for the next few days. By examining these indicators, we aim to provide a comprehensive and insightful analysis to guide your investment decisions.
Trend Analysis:
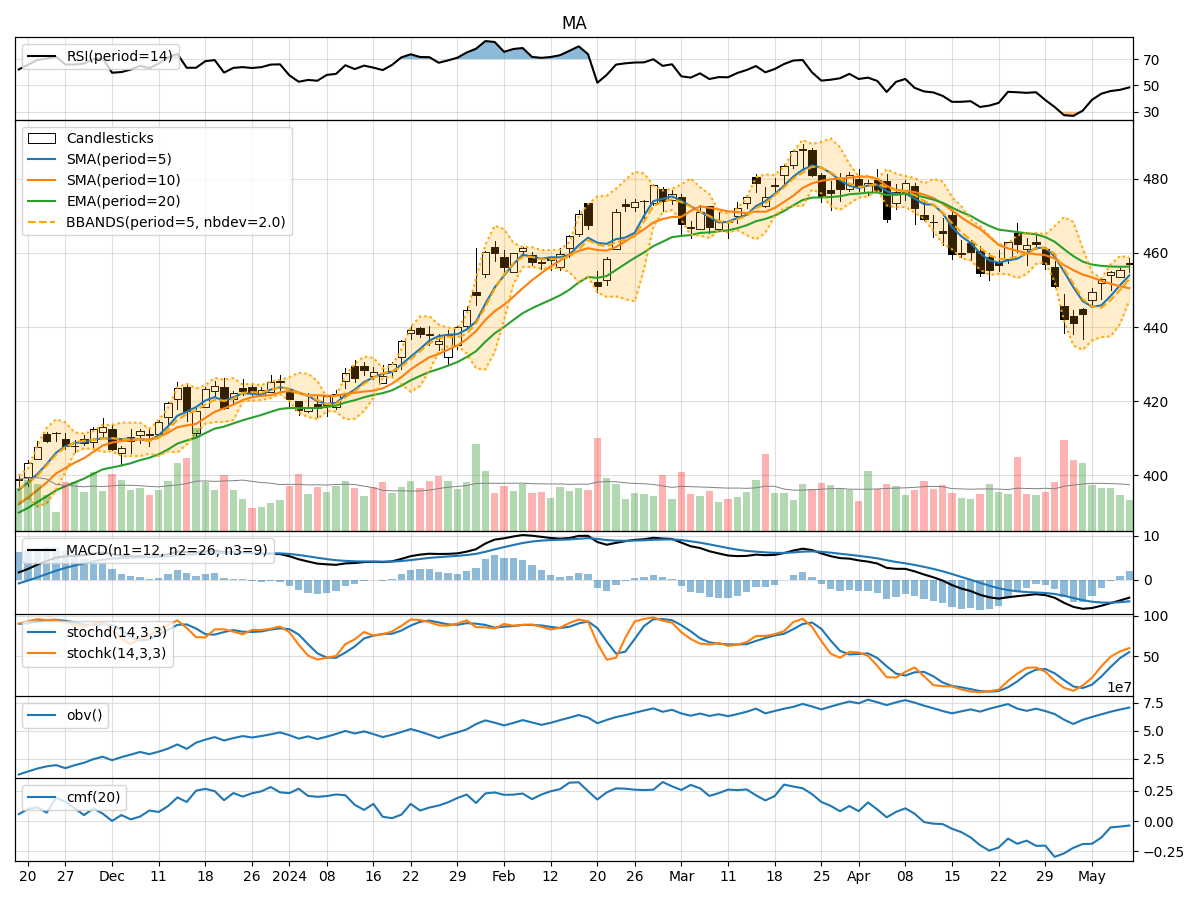
- Moving Averages (MA): The 5-day MA has been consistently increasing, indicating a bullish trend in the short term.
- Simple Moving Average (SMA) and Exponential Moving Average (EMA): Both SMA(10) and EMA(20) are above the current price, suggesting potential support levels.
- Moving Average Convergence Divergence (MACD): The MACD line has been decreasing, but still above the signal line, indicating a weakening bullish momentum.
- MACD Histogram: The histogram has been decreasing, signaling a potential reversal in the bullish trend.
Momentum Analysis:
- Relative Strength Index (RSI): RSI has been gradually increasing but remains below the overbought threshold, indicating room for further upside.
- Stochastic Oscillator (Stoch): Both %K and %D lines of the Stochastic Oscillator are in the overbought zone, suggesting a possible reversal or consolidation.
- Williams %R (WillR): WillR is in the oversold region, indicating a potential buying opportunity.
Volatility Analysis:
- Bollinger Bands (BB): The stock price has been trading within the Bollinger Bands, with the bands narrowing, suggesting reduced volatility.
- Bollinger Band Percentage (BBP): The BBP is relatively low, indicating a potential breakout or significant price movement.
Volume Analysis:
- On-Balance Volume (OBV): OBV has been steadily increasing, reflecting accumulation by investors.
- Chaikin Money Flow (CMF): CMF is negative, indicating selling pressure in the market.
Key Observations and Opinions:
- Trend: The short-term trend is bullish, supported by the moving averages. However, the weakening MACD and MACD histogram signal a potential trend reversal.
- Momentum: Mixed signals are observed with RSI showing potential for further upside, while Stoch and WillR suggest a possible reversal or consolidation.
- Volatility: Reduced volatility within the Bollinger Bands may precede a breakout, indicating a potential price movement.
- Volume: Increasing OBV indicates accumulation, but the negative CMF suggests selling pressure.
Conclusion:
Based on the analysis of the technical indicators, the stock is likely to experience sideways consolidation in the near term. While the trend remains bullish, the weakening momentum indicators and mixed signals from volatility and volume suggest a period of indecision in the market. Traders should exercise caution and closely monitor key support and resistance levels for potential breakout opportunities.