Technical Analysis of MAIN 2024-05-10
Overview:
In analyzing the technical indicators for MAIN stock over the last 5 days, we will delve into the trend, momentum, volatility, and volume indicators to provide a comprehensive outlook on the possible stock price movement in the coming days. By examining these key indicators, we aim to offer valuable insights and recommendations for potential investors.
Trend Analysis:
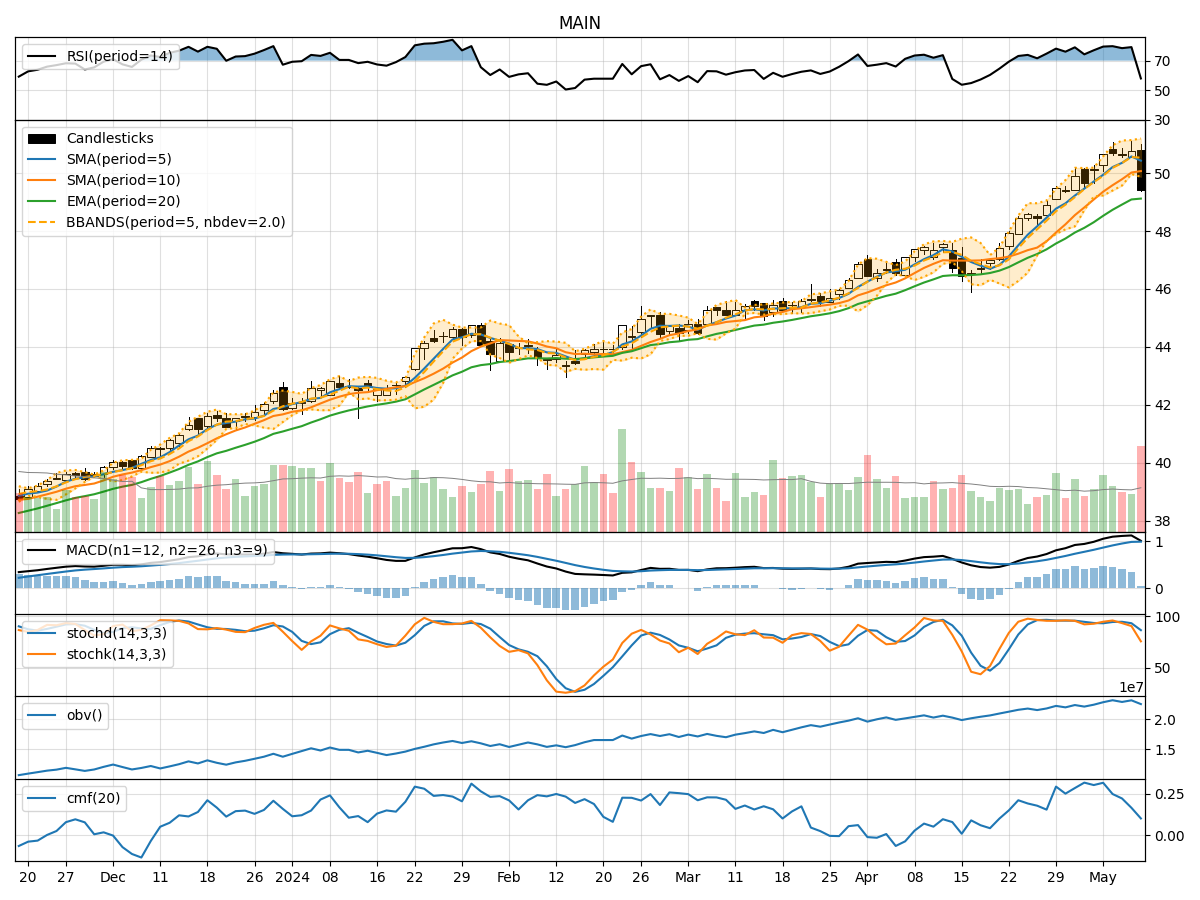
- Moving Averages (MA): The 5-day Moving Average (MA) has been consistently above the Simple Moving Average (SMA) and Exponential Moving Average (EMA), indicating a bullish trend.
- MACD: The MACD line has been above the signal line, suggesting a positive momentum in the stock price.
- RSI: The Relative Strength Index (RSI) has been relatively high, indicating overbought conditions.
Momentum Analysis:
- Stochastic Oscillator: The Stochastic Oscillator has been in the overbought zone, signaling a potential reversal in the stock price.
- Williams %R: The Williams %R indicator has been in the oversold territory, suggesting a possible bullish reversal.
Volatility Analysis:
- Bollinger Bands: The Bollinger Bands have shown widening bands, indicating increased volatility in the stock price.
- Volatility Percentage: The volatility percentage has been fluctuating, reflecting the changing market conditions.
Volume Analysis:
- On-Balance Volume (OBV): The OBV has shown mixed signals, with no clear trend in volume accumulation.
- Chaikin Money Flow (CMF): The CMF has been relatively low, indicating a lack of strong buying or selling pressure.
Key Observations:
- The stock has been in an uptrend based on moving averages and MACD.
- Momentum indicators suggest a potential reversal in the short term.
- Volatility has increased, indicating potential price swings.
- Volume indicators show mixed signals, with no clear accumulation or distribution pattern.
Conclusion:
Based on the analysis of the technical indicators, the stock is currently in an overbought state with increased volatility. The momentum indicators suggest a potential reversal in the short term, while volume indicators show mixed signals. Considering these factors, it is likely that the stock may experience a pullback or consolidation in the coming days. Investors should exercise caution and consider waiting for a clearer trend confirmation before making any significant trading decisions.