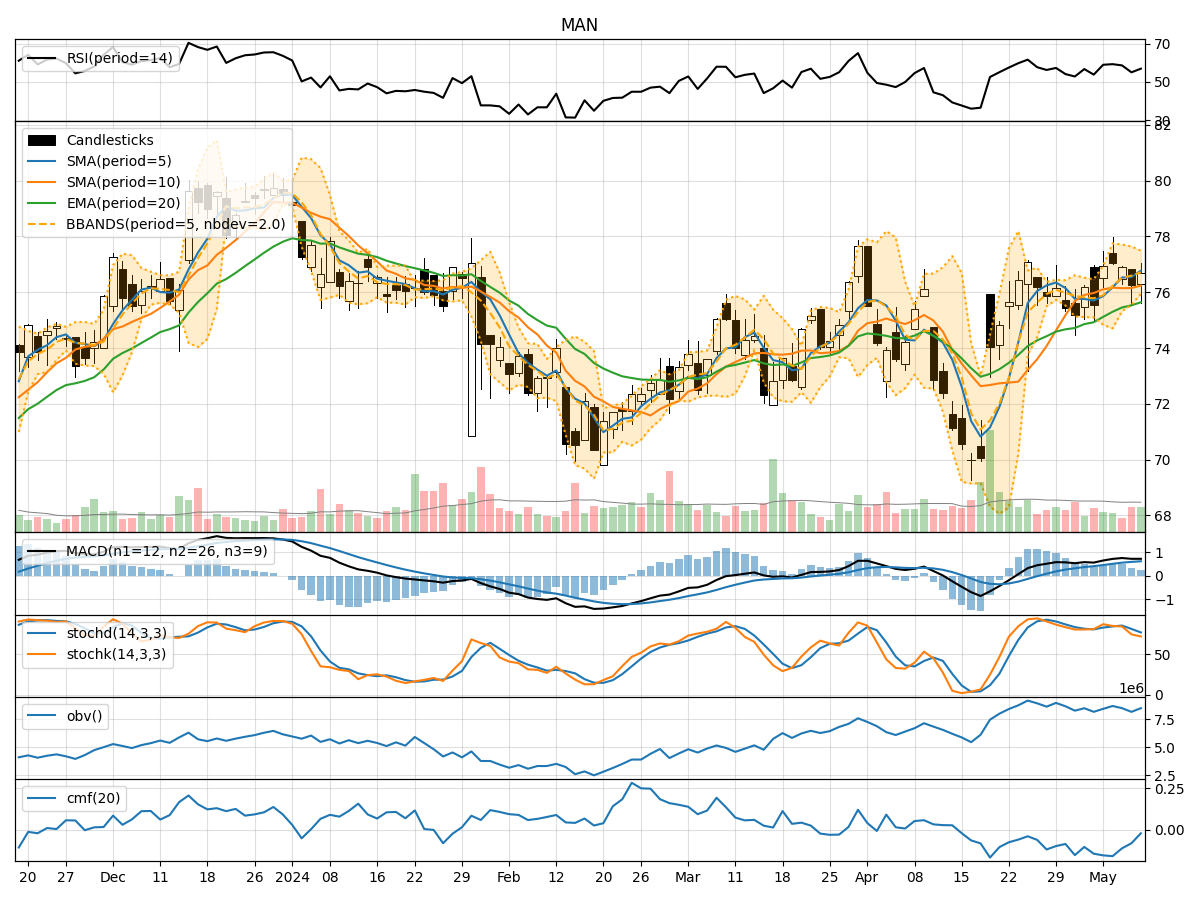
Technical Analysis of MAN 2024-05-10
Overview:
In analyzing the technical indicators for MAN over the last 5 days, we will delve into the trend, momentum, volatility, and volume indicators to provide a comprehensive outlook on the possible stock price movement in the coming days.
Trend Analysis:
- Moving Averages (MA): The 5-day Moving Average (MA) has been consistently above the Simple Moving Average (SMA) and Exponential Moving Average (EMA), indicating a bullish trend.
- MACD: The MACD line has been above the signal line, with both lines showing an upward trend, suggesting bullish momentum.
- MACD Histogram: The MACD Histogram has been consistently positive, indicating increasing bullish momentum.
Momentum Analysis:
- RSI: The Relative Strength Index (RSI) has been fluctuating around the 50 level, indicating a neutral momentum.
- Stochastic Oscillator: Both %K and %D lines of the Stochastic Oscillator have been trending downwards, suggesting a potential bearish momentum.
- Williams %R: The Williams %R indicator has been hovering around oversold levels, indicating a potential reversal in momentum.
Volatility Analysis:
- Bollinger Bands: The Bollinger Bands have been narrowing, indicating decreasing volatility in the stock price.
- Bollinger %B: The %B indicator has been fluctuating around the midline, suggesting a lack of clear direction in volatility.
Volume Analysis:
- On-Balance Volume (OBV): The OBV indicator has been showing a slight decrease, indicating a potential distribution phase.
- Chaikin Money Flow (CMF): The CMF has been negative, suggesting selling pressure in the stock.
Key Observations:
- The trend indicators point towards a bullish sentiment in the short term.
- Momentum indicators show a mixed signal, with a potential shift towards bearish momentum.
- Volatility has been decreasing, indicating a possible period of consolidation.
- Volume indicators suggest a slight decrease in buying pressure.
Conclusion:
Based on the analysis of the technical indicators, the next few days for MAN stock price movement could see sideways consolidation with a slight bearish bias. Traders should exercise caution and closely monitor key support and resistance levels for potential entry or exit points.