Technical Analysis of MAS 2024-05-10
Overview:
In analyzing the technical indicators for MAS stock over the last 5 days, we will delve into the trend, momentum, volatility, and volume indicators to provide a comprehensive outlook on the possible stock price movement in the coming days. By examining these key aspects, we aim to offer valuable insights and recommendations for potential investors.
Trend Indicators:
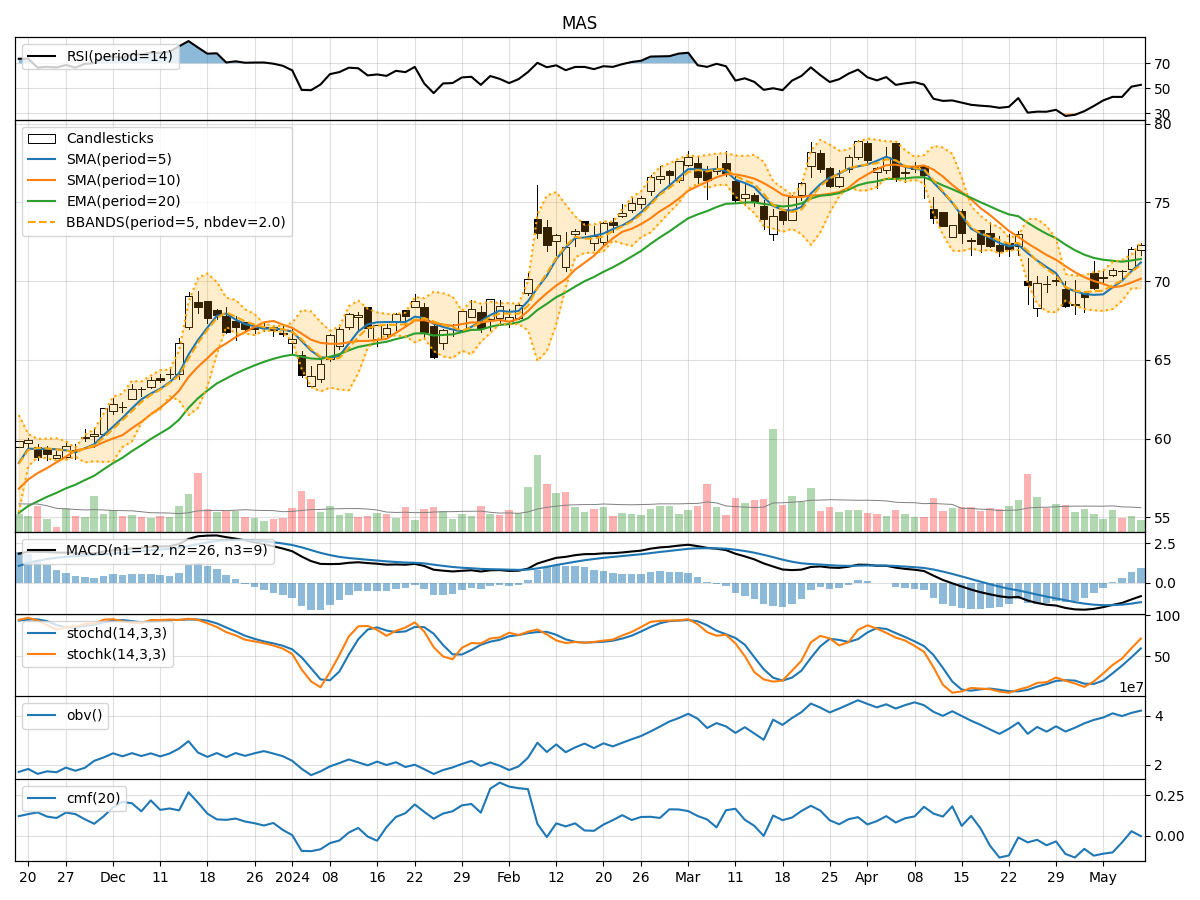
- Moving Averages (MA): The 5-day moving average has been consistently rising, indicating a bullish trend in the short term.
- MACD: The MACD line has been increasing, with the MACD histogram also showing positive values, suggesting bullish momentum.
- EMA: The exponential moving average has been trending upwards, supporting the bullish sentiment.
Momentum Indicators:
- RSI: The Relative Strength Index has been increasing, indicating strengthening momentum.
- Stochastic Oscillator: Both %K and %D lines have been rising, signaling bullish momentum.
- Williams %R: The indicator has been moving towards the oversold region, suggesting a potential reversal to the upside.
Volatility Indicators:
- Bollinger Bands: The stock price has been trading near the upper Bollinger Band, indicating increased volatility and a potential overbought condition.
- Bollinger %B: The %B value is above 0.8, suggesting a possible overbought situation.
Volume Indicators:
- On-Balance Volume (OBV): The OBV has been increasing, indicating accumulation by investors.
- Chaikin Money Flow (CMF): The CMF has been mostly negative, suggesting some selling pressure.
Key Observations and Opinions:
- Trend: The trend indicators point towards a bullish sentiment in the short term.
- Momentum: Momentum indicators support the bullish outlook, with RSI and Stochastic showing positive momentum.
- Volatility: Increased volatility near the upper Bollinger Band may signal a potential pullback or consolidation.
- Volume: The OBV suggests accumulation, while the CMF indicates some selling pressure.
Conclusion:
Based on the analysis of the technical indicators, the next few days for MAS stock are likely to see continued upward movement. The bullish trend supported by positive momentum indicators and increasing volume accumulation suggests that the stock price may experience further gains. However, caution is advised due to the elevated volatility near the upper Bollinger Band, which could lead to a short-term pullback before potential resumption of the uptrend. Investors should monitor the price action closely and consider risk management strategies to navigate potential market fluctuations.