Technical Analysis of MCK 2024-05-10
Overview:
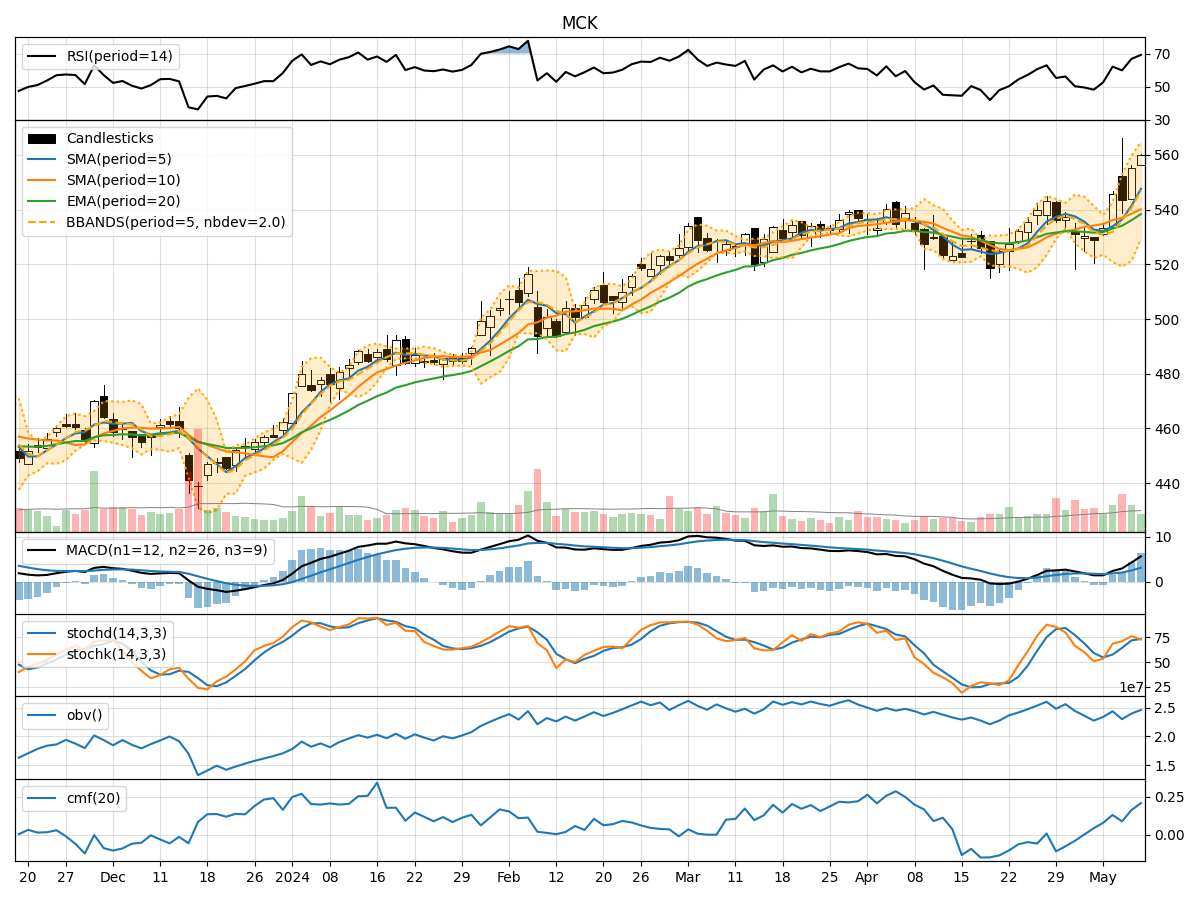
In analyzing the technical indicators for MCK over the last 5 days, we will delve into the trend, momentum, volatility, and volume indicators to provide a comprehensive outlook on the possible stock price movement in the coming days.
Trend Analysis:
- Moving Averages (MA): The 5-day Moving Average (MA) has been consistently rising, indicating an upward trend in the stock price.
- MACD: The MACD line has been above the signal line for the past 5 days, showing bullish momentum.
- EMA: The Exponential Moving Average (EMA) has also been trending upwards, supporting the bullish sentiment.
Momentum Analysis:
- RSI: The Relative Strength Index (RSI) has been increasing and is currently in the overbought territory, suggesting a strong bullish momentum.
- Stochastic Oscillator: Both %K and %D lines of the Stochastic Oscillator have been in the overbought zone, indicating a potential reversal or consolidation.
- Williams %R: The Williams %R is also in the overbought region, signaling a possible pullback.
Volatility Analysis:
- Bollinger Bands: The Bollinger Bands have been widening, indicating increased volatility in the stock price.
- Bollinger %B: The %B indicator has been fluctuating around 1, suggesting that the stock price is trading at the upper band, potentially indicating an overbought condition.
Volume Analysis:
- On-Balance Volume (OBV): The OBV has been increasing over the past 5 days, reflecting strong buying pressure in the stock.
- Chaikin Money Flow (CMF): The CMF has also been on the rise, indicating that money is flowing into the stock.
Conclusion:
Based on the technical indicators analyzed: - Trend: The stock is in a strong upward trend supported by moving averages and MACD. - Momentum: The momentum indicators suggest a bullish sentiment but also show signs of being overbought, indicating a potential pullback or consolidation. - Volatility: The widening Bollinger Bands suggest increased volatility, which could lead to sharp price movements. - Volume: The increasing OBV and CMF indicate strong buying pressure in the stock.
Overall Assessment:
Considering the overall technical analysis, the next few days for MCK are likely to see further upward movement in the stock price, supported by the strong trend and buying pressure. However, caution is advised as the momentum indicators are showing signs of being overbought, suggesting a potential pullback or consolidation in the near term. Traders and investors should closely monitor the price action and key support/resistance levels for timely decision-making.