Technical Analysis of MCW 2024-05-10
Overview:
In analyzing the technical indicators for MCW over the last 5 days, we will delve into the trend, momentum, volatility, and volume indicators to provide a comprehensive outlook on the possible stock price movement in the coming days. By examining these key aspects, we aim to offer valuable insights and recommendations for potential investors.
Trend Analysis:
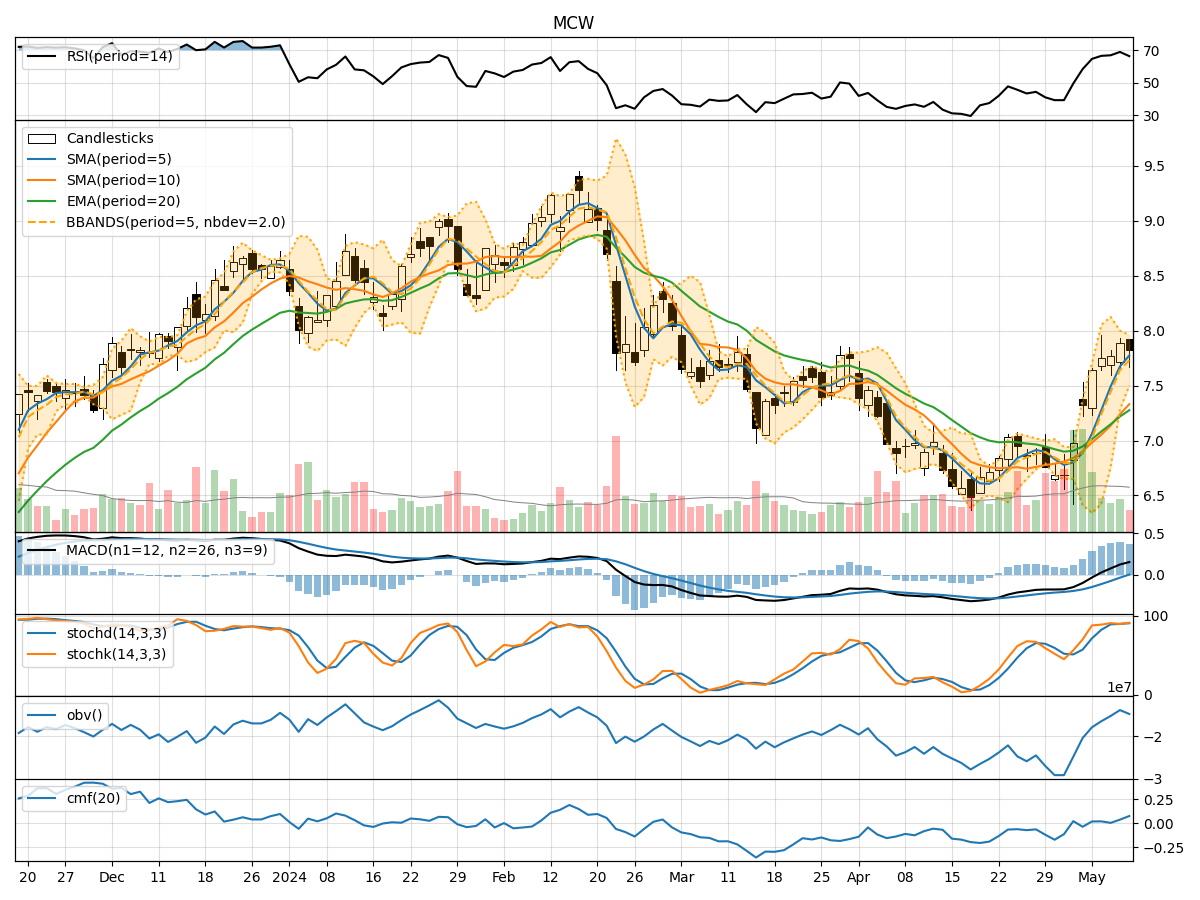
- Moving Averages (MA): The 5-day MA has been consistently above the closing prices, indicating an upward trend in the short term.
- MACD and Signal Line: The MACD has been positive and increasing, with the MACD line above the signal line, suggesting bullish momentum.
- Relative Strength Index (RSI): The RSI has been in the range of 60-70, indicating moderate bullish momentum.
Momentum Analysis:
- Stochastic Oscillator: Both %K and %D lines of the Stochastic Oscillator have been in the overbought zone, suggesting a potential reversal or consolidation.
- Williams %R (WillR): The Williams %R has been fluctuating around the oversold territory, indicating potential buying opportunities.
Volatility Analysis:
- Bollinger Bands (BB): The stock price has been trading within the upper and lower bands, indicating moderate volatility.
- Bollinger Band Width (BBW): The BBW has been narrowing, suggesting a potential decrease in volatility.
Volume Analysis:
- On-Balance Volume (OBV): The OBV has shown mixed signals, with some days experiencing negative volume divergence, indicating potential distribution.
- Chaikin Money Flow (CMF): The CMF has been positive, indicating buying pressure in the market.
Conclusion:
Based on the analysis of the technical indicators, the stock of MCW is currently exhibiting a mix of bullish and bearish signals. The trend indicators suggest an upward bias in the short term, supported by positive MACD and RSI readings. However, the momentum indicators, particularly the Stochastic Oscillator, hint at a potential reversal or consolidation due to overbought conditions. Volatility is moderate, with a slight decrease expected, while volume indicators show a mixed sentiment.
Recommendation:
Considering the overall analysis, it is advisable to exercise caution in the short term due to the potential for a reversal or consolidation indicated by the momentum indicators. Investors may consider waiting for clearer signals or implementing risk management strategies to navigate the current market dynamics. Long-term investors could monitor the trend indicators for sustained bullish momentum before considering entry positions.