Technical Analysis of MDU 2024-05-10
Overview:
In analyzing the technical indicators for MDU over the last 5 days, we will delve into the trend, momentum, volatility, and volume indicators to provide a comprehensive assessment of the stock's potential price movement. By examining these key factors, we aim to offer valuable insights and predictions for the next few days.
Trend Analysis:
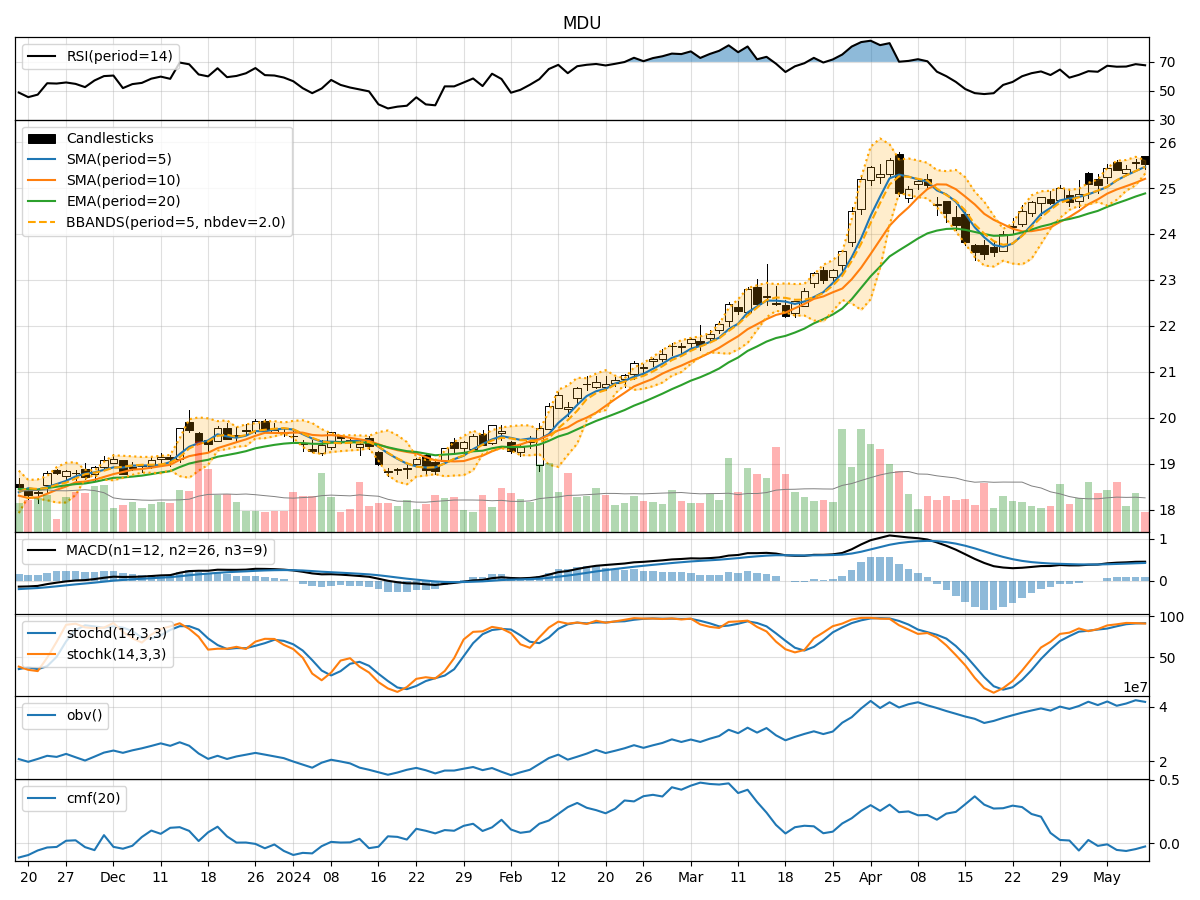
- Moving Averages (MA): The 5-day Moving Average (MA) has been consistently above the Simple Moving Average (SMA) and Exponential Moving Average (EMA), indicating a bullish trend.
- MACD: The MACD line has been consistently above the signal line, with both lines showing an upward trend, suggesting bullish momentum.
Momentum Analysis:
- RSI: The Relative Strength Index (RSI) has been hovering around 67-68, indicating a neutral to slightly bullish momentum.
- Stochastic Oscillator: Both %K and %D lines of the Stochastic Oscillator have been in the overbought zone, suggesting a potential reversal or consolidation.
Volatility Analysis:
- Bollinger Bands (BB): The stock price has been trading within the Bollinger Bands, with the bands narrowing, indicating decreasing volatility.
Volume Analysis:
- On-Balance Volume (OBV): The OBV has been fluctuating but has not shown a clear trend, suggesting indecision among investors.
- Chaikin Money Flow (CMF): The CMF has been negative, indicating selling pressure in the stock.
Key Observations:
- The trend indicators suggest a bullish sentiment, supported by the MACD and moving averages.
- Momentum indicators show a neutral to slightly bullish stance, with the RSI not indicating overbought conditions.
- Volatility has been decreasing, potentially signaling a period of consolidation.
- Volume indicators reflect indecision among investors, with selling pressure indicated by the CMF.
Conclusion:
Based on the analysis of the technical indicators, the next few days for MDU stock price movement could see sideways consolidation with a slight bullish bias. Investors may expect the stock to trade within a narrow range as volatility decreases. However, caution is advised as the Stochastic Oscillator signals potential overbought conditions, which could lead to a short-term pullback. It is essential to monitor key levels and wait for confirmation before making trading decisions.