Technical Analysis of MET 2024-05-10
Overview:
In analyzing the technical indicators for MET over the last 5 days, we will delve into the trend, momentum, volatility, and volume indicators to provide a comprehensive outlook on the possible stock price movement in the coming days. By examining these key aspects, we aim to offer valuable insights and predictions to guide investment decisions.
Trend Analysis:
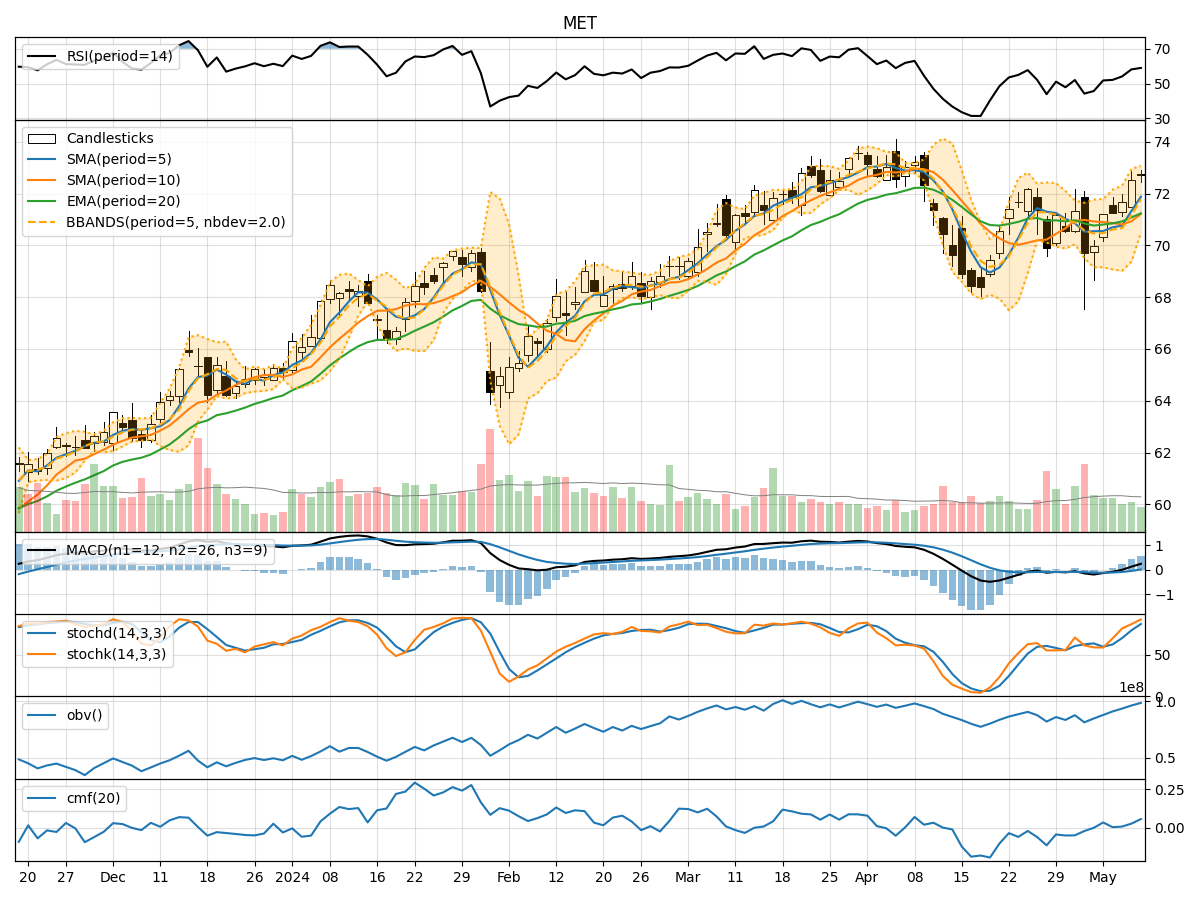
- Moving Averages (MA): The 5-day Moving Average (MA) has been steadily increasing, indicating a positive trend in the stock price.
- MACD: The Moving Average Convergence Divergence (MACD) has been consistently rising, with the MACD line crossing above the signal line, suggesting bullish momentum.
- EMA: The Exponential Moving Average (EMA) has been trending upwards, supporting the bullish sentiment in the short to medium term.
Momentum Analysis:
- RSI: The Relative Strength Index (RSI) has been climbing, indicating increasing buying pressure and potential overbought conditions.
- Stochastic Oscillator: Both %K and %D lines of the Stochastic Oscillator are in the overbought zone, signaling a potential reversal or consolidation.
- Williams %R: The Williams %R is nearing the oversold territory, suggesting a possible upcoming buying opportunity.
Volatility Analysis:
- Bollinger Bands (BB): The Bollinger Bands have been widening, indicating increased volatility in the stock price.
- BB% (Bollinger Band %B): The %B indicator is hovering around 0.8, suggesting the stock is trading near the upper band, potentially overbought.
- BBW (Bollinger Band Width): The Bollinger Band Width has been expanding, reflecting heightened price volatility.
Volume Analysis:
- On-Balance Volume (OBV): The OBV indicator has been steadily increasing, indicating strong buying volume accompanying the price rise.
- Chaikin Money Flow (CMF): The CMF is positive, suggesting that money is flowing into the stock, supporting the bullish outlook.
Conclusion:
Based on the analysis of the technical indicators, the stock price of MET is likely to experience a short-term pullback or consolidation in the coming days. The momentum indicators are showing signs of potential overbought conditions, while the volatility indicators suggest increased price fluctuations. Traders may consider taking profits or waiting for a better entry point before considering long positions. Exercise caution and monitor the price action closely for potential reversal signals before considering new positions.