Technical Analysis of MFC 2024-05-10
Overview:
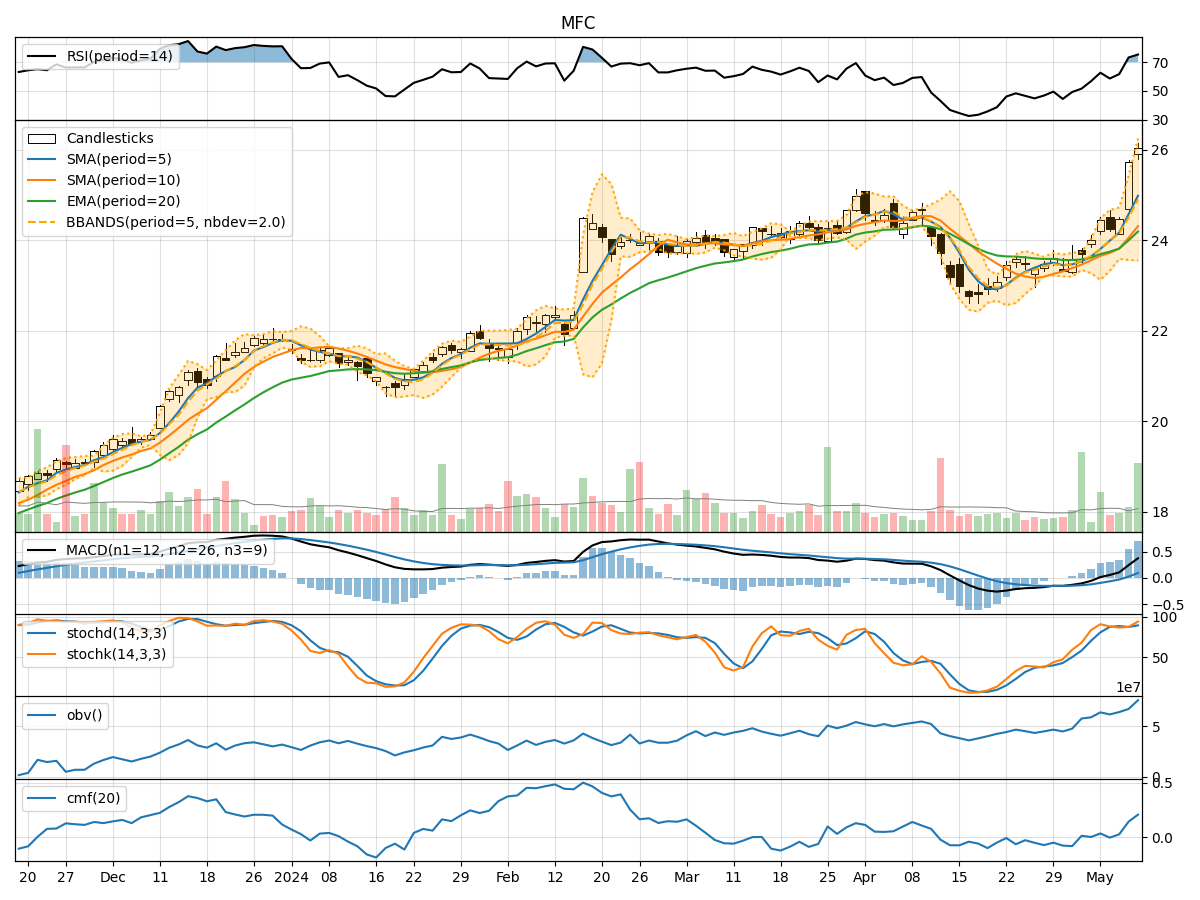
In analyzing the technical indicators for MFC over the last 5 days, we will delve into the trend, momentum, volatility, and volume indicators to provide a comprehensive outlook on the possible stock price movement. By examining these key aspects, we aim to offer valuable insights and predictions for the upcoming days.
Trend Indicators:
- Moving Averages (MA): The 5-day moving average has been consistently trending above the closing prices, indicating a bullish momentum in the short term.
- MACD: The MACD line has been steadily increasing, with the MACD histogram also showing positive values, suggesting a strengthening bullish trend.
- Conclusion: The trend indicators point towards an upward movement in the stock price.
Momentum Indicators:
- RSI: The Relative Strength Index has been in the overbought territory, indicating a strong buying momentum in the stock.
- Stochastic Oscillator: Both %K and %D lines of the Stochastic Oscillator have been in the overbought zone, signaling a potential reversal.
- Conclusion: The momentum indicators suggest a potential pullback or consolidation in the stock price.
Volatility Indicators:
- Bollinger Bands: The stock price has been trading near the upper Bollinger Band, indicating high volatility and a potential overbought condition.
- Conclusion: Volatility indicators imply a possible correction or sideways movement in the stock price.
Volume Indicators:
- On-Balance Volume (OBV): The OBV has been steadily increasing, reflecting strong buying pressure in the stock.
- Chaikin Money Flow (CMF): The CMF has been positive, indicating accumulation by investors.
- Conclusion: Volume indicators suggest a continued bullish sentiment in the stock.
Overall Conclusion:
Based on the analysis of the technical indicators, the stock of MFC is likely to experience a short-term pullback or consolidation after the recent bullish rally. The momentum indicators signal a potential reversal, while volatility indicators point towards a correction or sideways movement. However, the overall trend remains bullish, supported by strong volume indicators.
Recommendation:
- Short-term Traders: Consider taking profits or tightening stop-loss levels to protect gains during the expected pullback.
- Long-term Investors: Use the potential dip as a buying opportunity to accumulate more shares at a better price for the long term.
Disclaimer:
It is important to note that technical analysis is not a guaranteed predictor of future price movements, and market dynamics can change rapidly. It is advisable to conduct further research and consider fundamental factors before making any investment decisions. Consulting with a financial advisor is recommended for personalized guidance tailored to individual investment goals and risk tolerance levels.