Technical Analysis of MGA 2024-05-10
Overview:
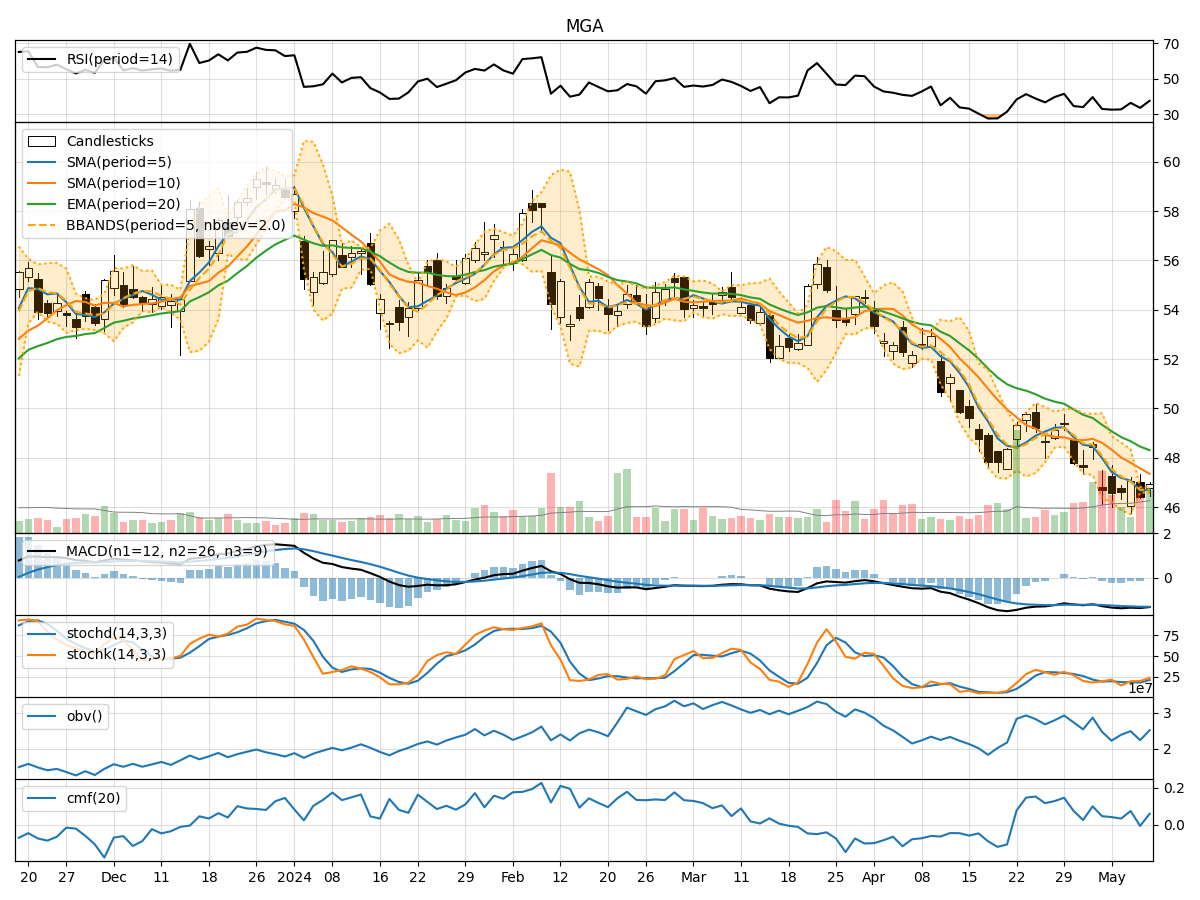
In analyzing the technical indicators for MGA over the last 5 days, we will delve into the trend, momentum, volatility, and volume indicators to provide a comprehensive outlook on the possible stock price movement in the coming days. By examining these key indicators, we aim to offer valuable insights and predictions for potential investors.
Trend Analysis:
- Moving Averages (MA): The 5-day MA has been consistently below the closing prices, indicating a short-term downtrend.
- MACD: The MACD line has been below the signal line, suggesting a bearish momentum in the stock.
- EMA: The EMA has been trending downwards, reflecting a weakening trend in the stock price.
Momentum Analysis:
- RSI: The RSI has been hovering around the oversold territory, indicating a potential reversal or consolidation phase.
- Stochastic Oscillator: Both %K and %D have been relatively low, signaling a potential oversold condition.
- Williams %R: The Williams %R has been consistently in the oversold region, suggesting a bearish sentiment.
Volatility Analysis:
- Bollinger Bands: The stock price has been trading within the lower Bollinger Band, indicating a potential oversold condition.
- Bollinger %B: The %B indicator has been below 0.2, suggesting a possible undervalued scenario.
Volume Analysis:
- On-Balance Volume (OBV): The OBV has been fluctuating, indicating mixed buying and selling pressure.
- Chaikin Money Flow (CMF): The CMF has been positive but relatively low, suggesting a neutral sentiment in terms of money flow.
Key Observations:
- The stock is currently in a downtrend based on moving averages and MACD.
- Momentum indicators point towards a potential reversal or consolidation phase.
- Volatility indicators suggest the stock may be oversold.
- Volume indicators show mixed buying and selling pressure.
Conclusion:
Based on the analysis of the technical indicators, the stock is likely to experience a short-term consolidation or potential reversal in the coming days. Investors should closely monitor key support and resistance levels for any signs of a trend reversal. It is advisable to exercise caution and wait for clearer signals before making any significant trading decisions.