Technical Analysis of MHK 2024-05-10
Overview:
In analyzing the technical indicators for MHK over the last 5 days, we will delve into the trend, momentum, volatility, and volume indicators to provide a comprehensive outlook on the possible stock price movement. By examining these key aspects, we aim to offer valuable insights and predictions for the upcoming days.
Trend Analysis:
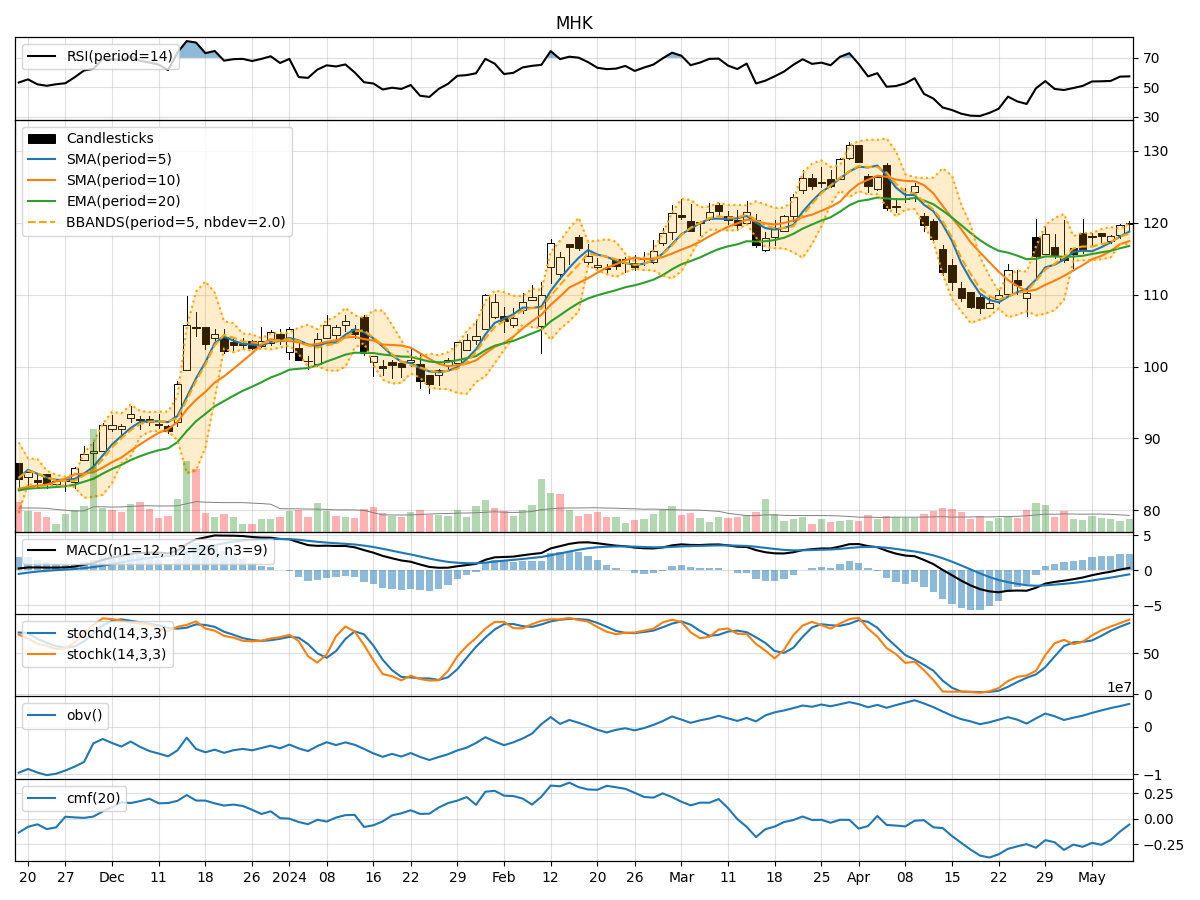
- Moving Averages (MA): The 5-day Moving Average (MA) has been consistently rising, indicating a bullish trend in the short term.
- MACD: The MACD line has been above the signal line for all 5 days, suggesting positive momentum in the stock price.
- RSI: The Relative Strength Index (RSI) has been increasing, showing strengthening buying pressure.
Momentum Analysis:
- Stochastic Oscillator: Both %K and %D values have been in the overbought territory, signaling a potential reversal or consolidation.
- Williams %R: The Williams %R indicator has been hovering in the oversold region, indicating a possible buying opportunity.
Volatility Analysis:
- Bollinger Bands: The stock price has been trading within the upper Bollinger Band, suggesting an overbought condition.
- Volatility: The Bollinger Bands' width has been narrowing, indicating decreasing volatility in the stock.
Volume Analysis:
- On-Balance Volume (OBV): The OBV has been steadily increasing, reflecting strong buying interest in the stock.
- Chaikin Money Flow (CMF): The CMF has been negative, indicating a slight outflow of money from the stock.
Key Observations:
- The trend indicators suggest a bullish sentiment in the short term.
- Momentum indicators show signs of potential overbought conditions.
- Volatility indicators point towards decreasing volatility.
- Volume indicators indicate a positive accumulation of the stock.
Conclusion:
Based on the analysis of the technical indicators, the next few days' possible stock price movement for MHK is likely to be sideways to slightly bearish. While the trend remains bullish in the short term, the overbought signals from momentum indicators and narrowing volatility suggest a possible consolidation or minor pullback in the stock price. Investors should closely monitor key support levels and consider potential profit-taking opportunities in the near future.