Technical Analysis of MHO 2024-05-10
Overview:
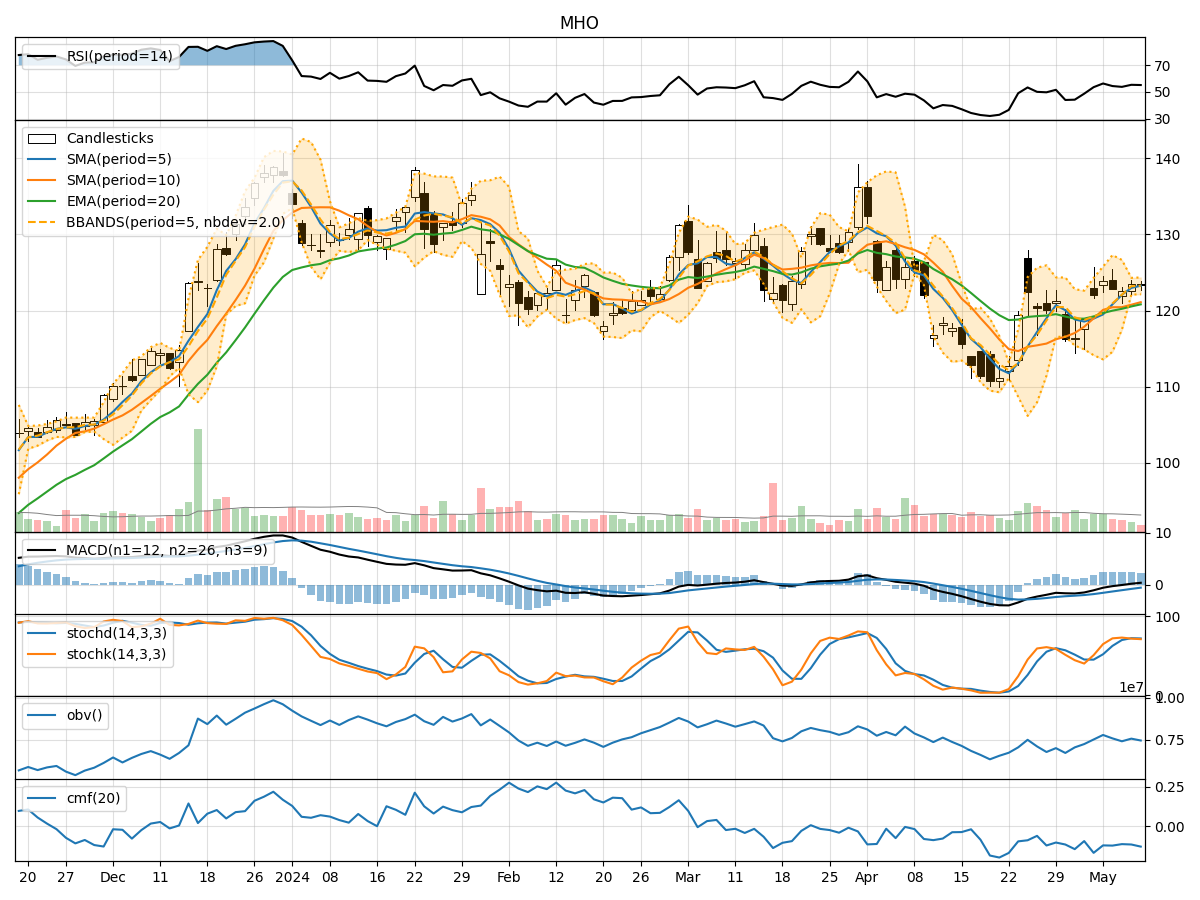
In analyzing the technical indicators for MHO over the last 5 days, we will delve into the trend, momentum, volatility, and volume indicators to provide a comprehensive assessment of the stock's potential price movement. By examining these key factors, we aim to offer insights and predictions for the next few days.
Trend Analysis:
- Moving Averages (MA): The 5-day MA has been consistently above the closing prices, indicating a bullish trend.
- MACD: The MACD line has been positive, suggesting upward momentum in the stock price.
- EMA: The EMA has been trending upwards, supporting the bullish sentiment in the short to medium term.
Key Observation: The trend indicators point towards a bullish outlook for MHO.
Momentum Analysis:
- RSI: The RSI has been fluctuating around the 50 level, indicating a neutral momentum.
- Stochastic Oscillator: Both %K and %D have been hovering around the overbought territory, suggesting a potential reversal.
- Williams %R: The indicator has been in the oversold region, signaling a possible buying opportunity.
Key Observation: The momentum indicators suggest a neutral to slightly bearish momentum for MHO.
Volatility Analysis:
- Bollinger Bands (BB): The bands have been narrowing, indicating decreasing volatility.
- BB %B: The %B has been relatively stable, suggesting a lack of significant price movements.
- Average True Range (ATR): The ATR has been decreasing, reflecting lower volatility levels.
Key Observation: Volatility indicators point towards a consolidation phase for MHO.
Volume Analysis:
- On-Balance Volume (OBV): The OBV has been fluctuating, indicating indecision among investors.
- Chaikin Money Flow (CMF): The CMF has been negative, suggesting outflow of money from the stock.
Key Observation: Volume indicators reflect a neutral to slightly bearish sentiment for MHO.
Conclusion:
Based on the analysis of trend, momentum, volatility, and volume indicators, the next few days' possible stock price movement for MHO is likely to be sideways with a slight bearish bias. While the trend indicators signal a bullish outlook, the momentum and volume indicators suggest a more cautious approach. The decreasing volatility indicates a period of consolidation, further supporting the sideways movement.
Key Conclusion: The overall assessment leans towards a sideways movement with a slight bearish bias for MHO in the upcoming days. Investors should closely monitor key support and resistance levels for potential trading opportunities.