Technical Analysis of MKC 2024-05-10
Overview:
In analyzing the technical indicators for MKC over the last 5 days, we will delve into the trend, momentum, volatility, and volume indicators to provide a comprehensive outlook on the possible stock price movement in the coming days. By examining these key aspects, we aim to offer valuable insights and predictions for informed decision-making.
Trend Indicators:
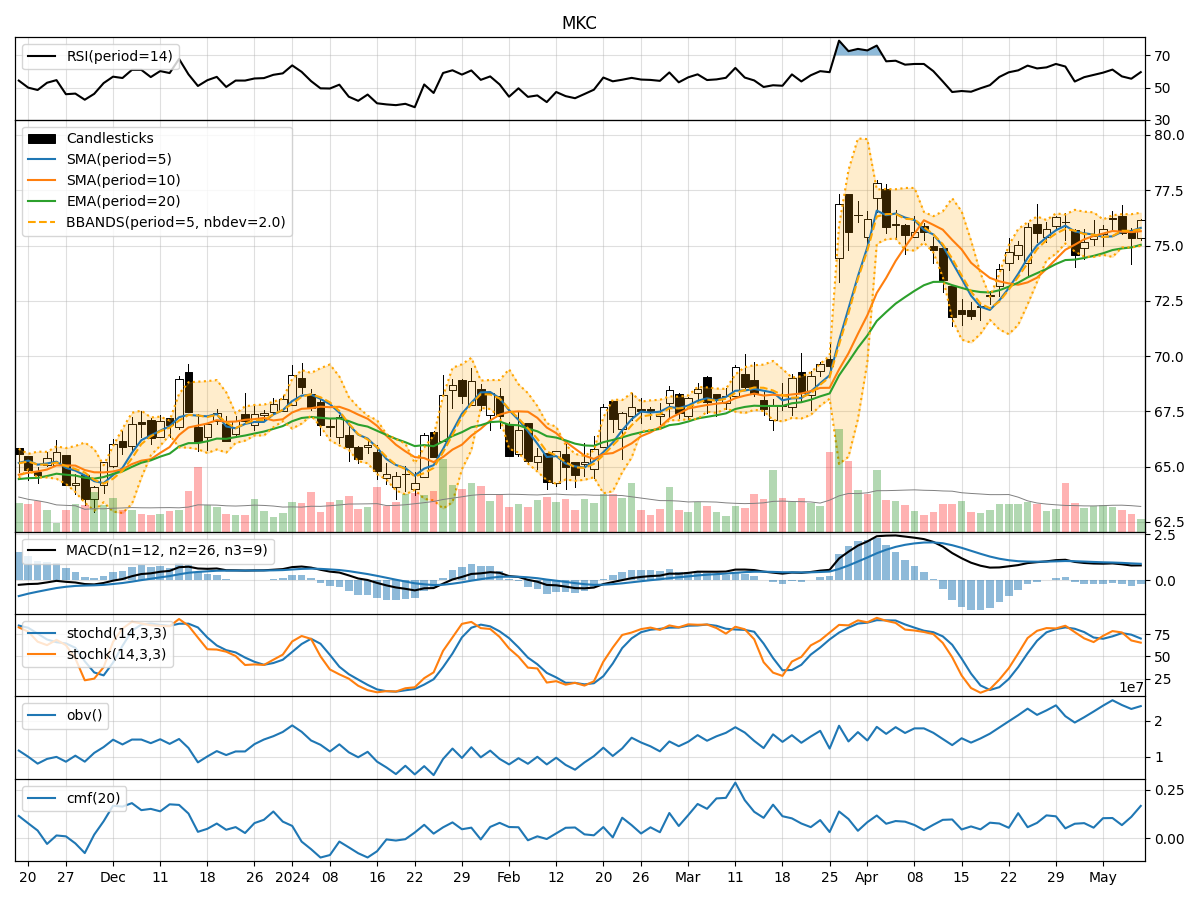
- Moving Averages (MA): The 5-day MA has been fluctuating around the closing prices, indicating short-term price trends. The SMA(10) and EMA(20) show a slight divergence, suggesting potential price volatility.
- MACD: The MACD line has been hovering around the signal line, indicating a lack of strong momentum in either direction.
- MACD Histogram: The histogram has been negative, reflecting a bearish sentiment in the short term.
Momentum Indicators:
- RSI: The RSI values have been fluctuating around the mid-level, indicating a balanced momentum between buying and selling pressure.
- Stochastic Oscillator: Both %K and %D have been declining, suggesting a weakening bullish momentum.
- Williams %R: The indicator has been in the oversold territory, indicating a potential reversal in the short term.
Volatility Indicators:
- Bollinger Bands: The bands have been narrowing, indicating decreasing volatility and a potential price breakout in the near future.
- Bollinger %B: The %B indicator has been fluctuating around the mid-level, suggesting a balanced market sentiment.
Volume Indicators:
- On-Balance Volume (OBV): The OBV has shown mixed signals, reflecting indecision among investors regarding the stock's direction.
- Chaikin Money Flow (CMF): The CMF has been positive, indicating a net inflow of money into the stock over the past 20 days.
Key Observations and Opinions:
- Trend: The trend indicators suggest a lack of clear direction in the short term, with potential price volatility.
- Momentum: Momentum indicators indicate a neutral stance with a slight bearish bias, signaling caution for traders.
- Volatility: Volatility indicators point towards a potential breakout, with decreasing volatility paving the way for a significant price movement.
- Volume: Volume indicators reflect mixed signals, highlighting uncertainty among market participants.
Conclusion:
Based on the analysis of the technical indicators, the stock price of MKC is likely to experience sideways consolidation in the coming days. The lack of strong trends, coupled with mixed momentum and volume signals, suggests a period of indecision and potential range-bound trading. Traders should exercise caution and wait for clearer signals before taking significant positions.