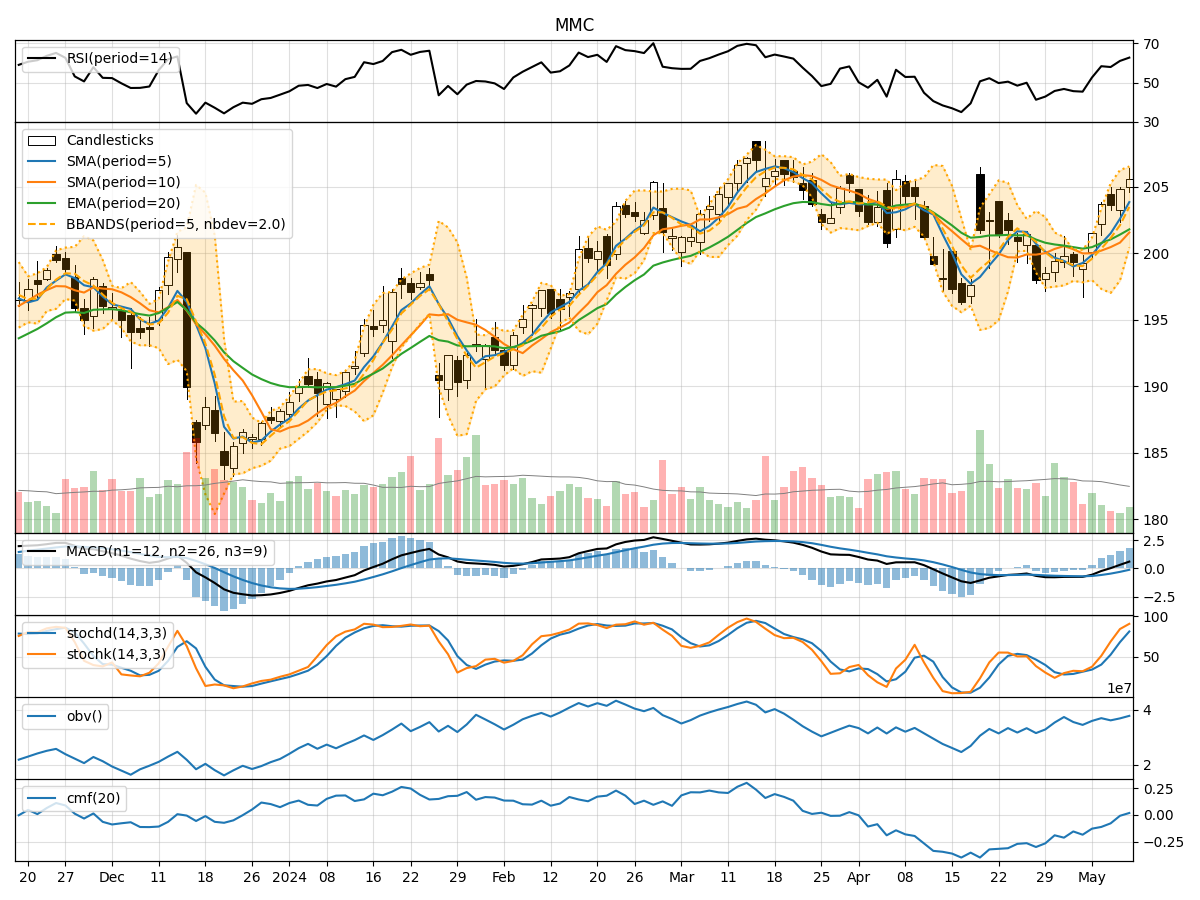
Technical Analysis of MMC 2024-05-10
Overview:
In analyzing the technical indicators for MMC over the last 5 days, we will delve into the trend, momentum, volatility, and volume indicators to provide a comprehensive outlook on the possible stock price movement in the coming days.
Trend Analysis:
- Moving Averages (MA): The 5-day Moving Average has been consistently rising, indicating a bullish trend in the short term.
- MACD: The MACD line has been above the signal line, suggesting a bullish momentum.
- EMA: The Exponential Moving Average has also been trending upwards, supporting the bullish sentiment.
Momentum Analysis:
- RSI: The Relative Strength Index has been increasing, showing strengthening buying momentum.
- Stochastic Oscillator: Both %K and %D have been in the overbought zone, indicating a potential reversal or consolidation.
- Williams %R: The indicator has been hovering in the oversold territory, suggesting a possible buying opportunity.
Volatility Analysis:
- Bollinger Bands: The stock price has been trading near the upper Bollinger Band, indicating high volatility and a potential overbought condition.
- Bollinger %B: The %B value has been above 0.8, signaling a potential overbought situation.
Volume Analysis:
- On-Balance Volume (OBV): The OBV has shown mixed signals, with fluctuations in volume accumulation.
- Chaikin Money Flow (CMF): The CMF has been negative, indicating selling pressure in the market.
Key Observations:
- The trend indicators suggest a bullish sentiment in the short term.
- Momentum indicators show a mix of overbought and oversold conditions, hinting at a possible reversal or consolidation.
- Volatility indicators point towards high volatility and a potential overbought scenario.
- Volume indicators reflect mixed signals with fluctuations in volume accumulation.
Conclusion:
Based on the analysis of the technical indicators, the next few days may see a continuation of the bullish trend in MMC. However, caution is advised as some momentum indicators are signaling potential overbought conditions, which could lead to a short-term pullback or consolidation. Traders should closely monitor key support and resistance levels, as well as watch for any signs of trend reversal in the coming days.