Technical Analysis of MOG.A 2024-05-10
Overview:
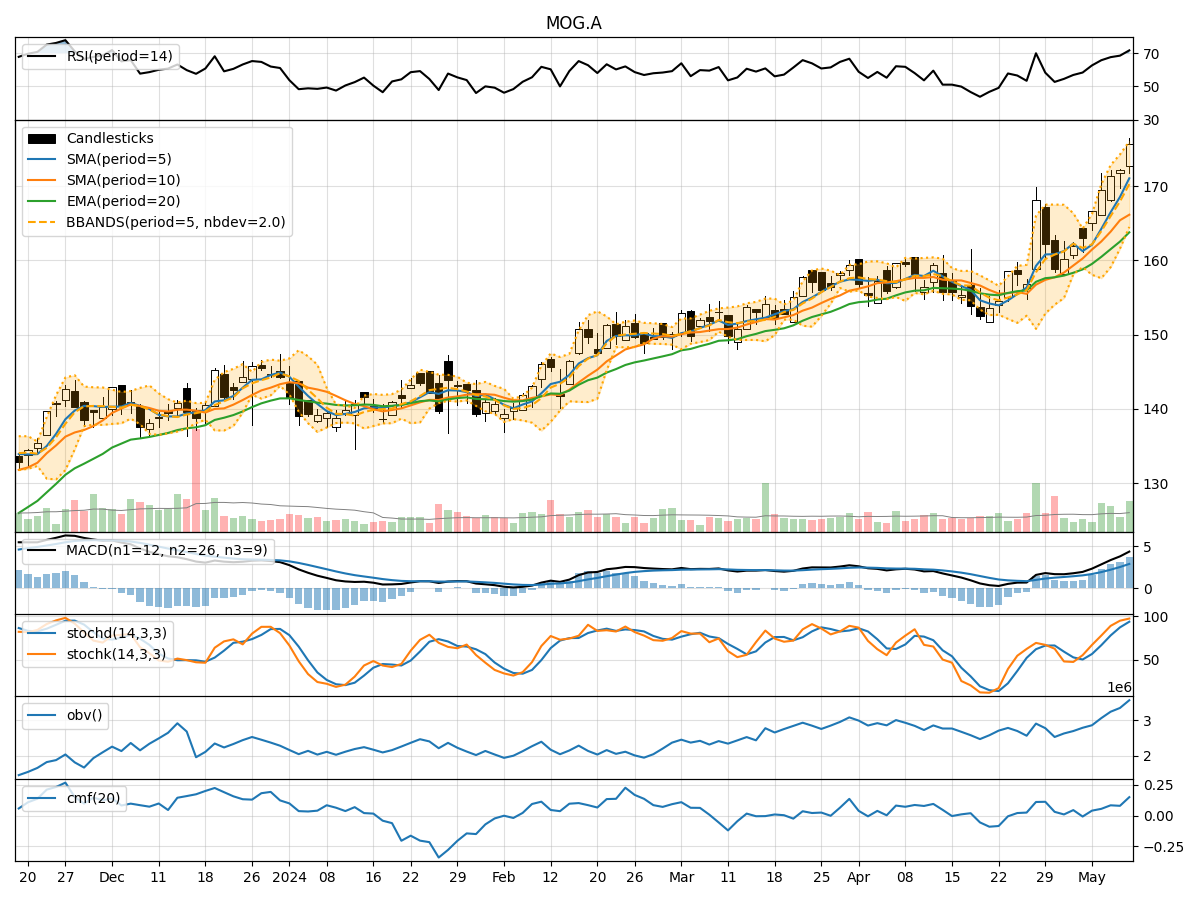
In analyzing the technical indicators for MOG.A over the last 5 days, we will delve into the trend, momentum, volatility, and volume indicators to provide a comprehensive outlook on the possible stock price movement in the coming days.
Trend Analysis:
- Moving Averages (MA): The 5-day Moving Average has been consistently rising, indicating an upward trend in the stock price.
- MACD: The MACD line has been increasing, and the MACD Histogram is also showing an uptrend, suggesting bullish momentum.
Momentum Analysis:
- RSI: The Relative Strength Index (RSI) has been increasing and is currently in the overbought territory, signaling a strong bullish momentum.
- Stochastic Oscillator: Both %K and %D lines are in the overbought zone, indicating a potential reversal or consolidation.
Volatility Analysis:
- Bollinger Bands: The stock price has been consistently trading above the middle Bollinger Band, indicating an uptrend with moderate volatility.
Volume Analysis:
- On-Balance Volume (OBV): The OBV has been steadily increasing, reflecting strong buying pressure in the stock.
- Chaikin Money Flow (CMF): The CMF is positive, suggesting that money is flowing into the stock.
Key Observations:
- The stock is in a strong uptrend based on moving averages and MACD.
- Momentum indicators like RSI and Stochastic Oscillator suggest overbought conditions, indicating a potential reversal or consolidation.
- Volatility is moderate, as indicated by Bollinger Bands.
- Volume indicators show strong buying pressure with increasing OBV and positive CMF.
Conclusion:
Based on the technical analysis of the indicators: - The stock is currently in an upward trend with strong bullish momentum. - However, the overbought conditions on RSI and Stochastic Oscillator suggest a potential reversal or consolidation in the short term. - Volatility is moderate, indicating a stable price movement. - Considering the strong buying pressure indicated by OBV and CMF, the stock is likely to experience a brief consolidation phase before potentially resuming its uptrend.
Recommendation:
- Short-term traders may consider taking profits or waiting for a pullback before entering new positions.
- Long-term investors can hold their positions, considering the overall bullish trend and strong buying pressure.
- Monitoring the price action and key support levels will be crucial in determining the next potential entry points.
Disclaimer:
Remember that market conditions can change rapidly, and it is essential to stay updated on the latest developments and news that may impact the stock price. Always consider using stop-loss orders and risk management strategies to protect your investments.