Technical Analysis of MP 2024-05-10
Overview:
In analyzing the technical indicators for the stock of MP over the last 5 days, we will delve into the trend, momentum, volatility, and volume indicators to provide a comprehensive outlook on the possible stock price movement in the coming days. By examining these key indicators, we aim to offer valuable insights and predictions to guide your investment decisions.
Trend Analysis:
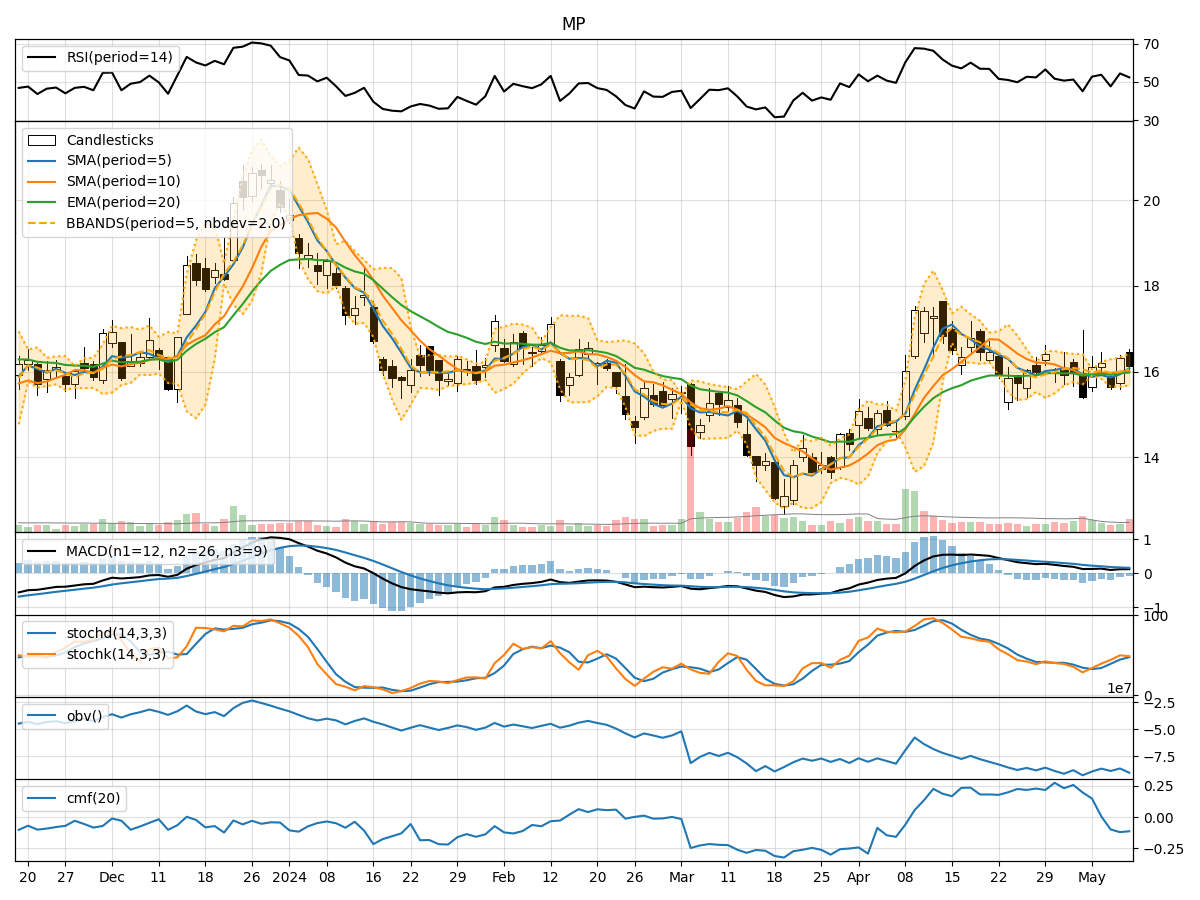
- Moving Averages (MA): The 5-day Moving Average (MA) has been fluctuating around the closing prices, indicating short-term price trends. The Simple Moving Average (SMA) and Exponential Moving Average (EMA) show a slight upward trend, suggesting potential bullish momentum.
- MACD: The Moving Average Convergence Divergence (MACD) and its signal line have been positive, indicating a bullish trend. However, the MACD Histogram has been decreasing, signaling a potential slowdown in bullish momentum.
Momentum Analysis:
- RSI: The Relative Strength Index (RSI) has been hovering around the neutral zone, indicating a balanced momentum between buying and selling pressure.
- Stochastic Oscillator: Both %K and %D lines of the Stochastic Oscillator have been in the overbought territory, suggesting a potential reversal or consolidation phase.
- Williams %R: The Williams %R indicator has been in the oversold region, indicating a possible buying opportunity.
Volatility Analysis:
- Bollinger Bands (BB): The Bollinger Bands have been narrowing, suggesting decreasing volatility in the stock price. The bands are relatively close to the moving average, indicating a potential breakout or significant price movement.
- Bollinger %B: The %B indicator has been fluctuating around the middle range, indicating a balanced volatility level.
Volume Analysis:
- On-Balance Volume (OBV): The OBV has been fluctuating, indicating mixed buying and selling pressure in the stock.
- Chaikin Money Flow (CMF): The CMF has been negative, suggesting a net outflow of money from the stock over the analyzed period.
Conclusion:
Based on the analysis of the technical indicators, the stock of MP is currently in a consolidation phase with mixed signals across different indicators. The trend indicators suggest a potential bullish bias in the short term, supported by the moving averages and MACD. However, the momentum indicators show signs of overbought conditions and a possible reversal in the near future.
Considering the narrowing Bollinger Bands and mixed volume indicators, we anticipate a sideways movement or limited price action in the coming days. Traders should exercise caution and wait for clearer signals before making significant trading decisions. It is advisable to closely monitor key support and resistance levels for potential breakout opportunities.
In conclusion, while the short-term outlook may favor a slight upward bias, the overall market dynamics suggest a cautious approach with a focus on risk management strategies.