Technical Analysis of MSA 2024-05-10
Overview:
In analyzing the technical indicators for MSA stock over the last 5 days, we will delve into the trends, momentum, volatility, and volume aspects to provide a comprehensive outlook on the possible stock price movement in the coming days. By examining key indicators such as moving averages, MACD, RSI, Bollinger Bands, and OBV, we aim to offer valuable insights and predictions for potential price action.
Trend Analysis:
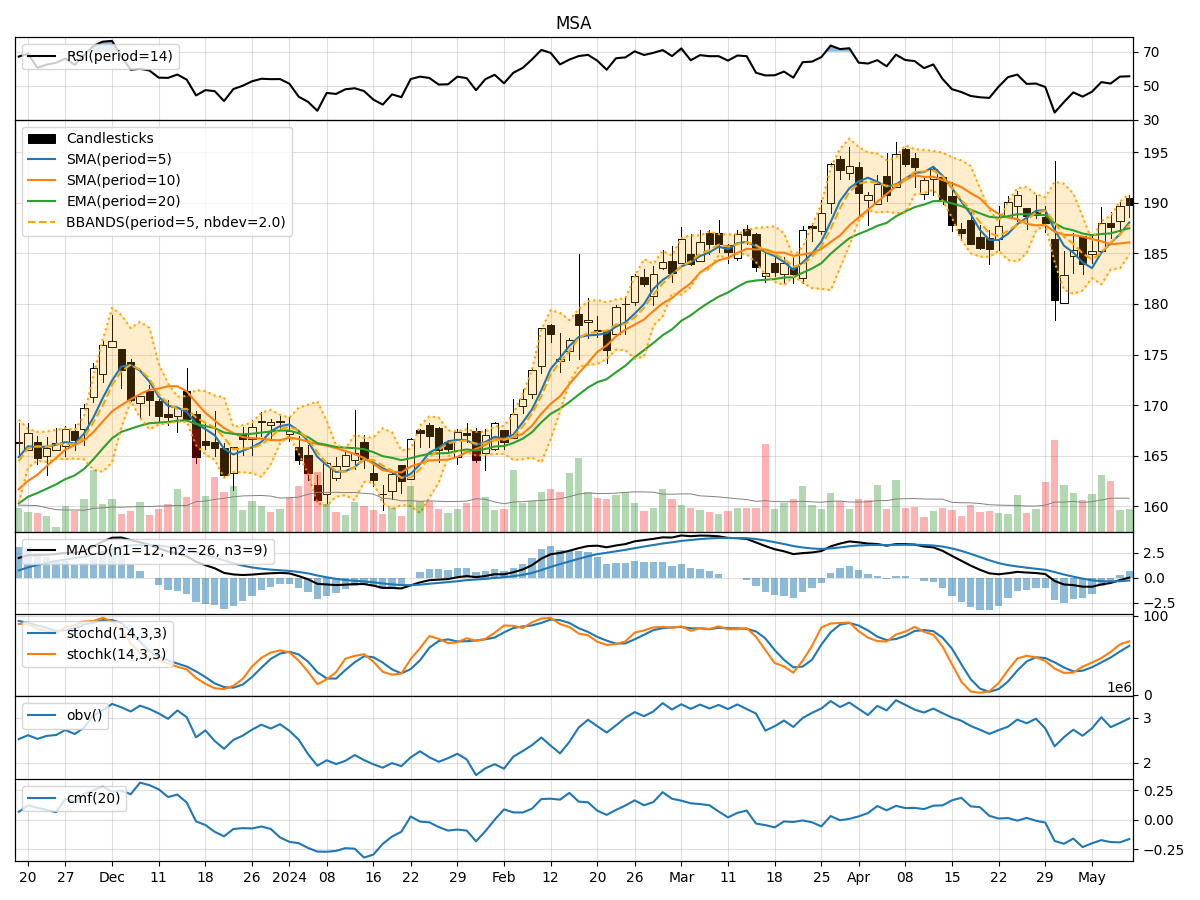
- Moving Averages (MA): The 5-day moving average has been showing an upward trend, indicating a positive momentum in the short term.
- MACD: The MACD line has been gradually increasing, with the MACD histogram also moving towards the zero line, suggesting a potential bullish crossover.
- EMA: The exponential moving average has been on an upward trajectory, further supporting the bullish sentiment.
Momentum Analysis:
- RSI: The RSI has been consistently above 50, indicating bullish momentum in the stock.
- Stochastic Oscillator: Both %K and %D lines of the stochastic oscillator have been rising, signaling increasing buying pressure.
- Williams %R: The Williams %R is in the oversold territory, suggesting a potential reversal to the upside.
Volatility Analysis:
- Bollinger Bands: The stock price has been trading within the upper Bollinger Band, indicating an overbought condition. However, the bands are widening, suggesting increased volatility.
- Bollinger %B: The %B indicator is above 0.8, indicating a potential overbought situation.
Volume Analysis:
- On-Balance Volume (OBV): The OBV indicator has been fluctuating but overall showing a slight increase, reflecting accumulation by investors.
- Chaikin Money Flow (CMF): The CMF has been negative, indicating some selling pressure in the stock.
Conclusion:
Based on the analysis of the technical indicators, the stock of MSA is bullish in the short term. The moving averages, MACD, RSI, and stochastic oscillator all point towards a potential upward movement in the stock price. While there might be some volatility due to the overbought condition indicated by the Bollinger Bands, the overall momentum and trend suggest a continuation of the bullish sentiment.
Key Takeaways: - Upward Trend: The stock is likely to continue its upward trajectory. - Bullish Momentum: Momentum indicators support further price appreciation. - Volatility Warning: Watch out for potential pullbacks due to overbought conditions. - Accumulation: OBV shows investors are accumulating the stock.
In conclusion, considering the technical indicators and the current market dynamics, it is highly probable that the stock price of MSA will experience further upward movement in the coming days. Investors may consider maintaining or initiating long positions based on this analysis.