Technical Analysis of MSGS 2024-05-10
Overview:
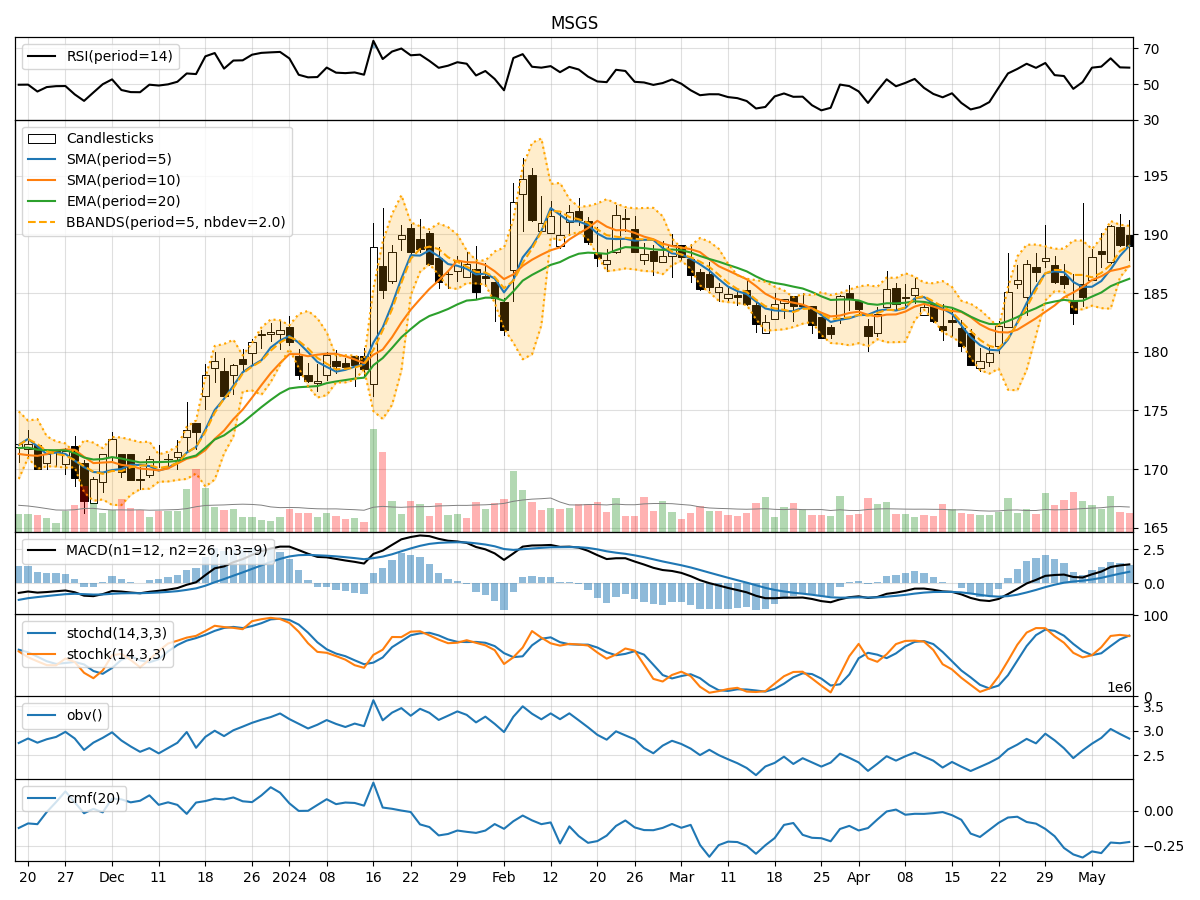
In the last 5 trading days, MSGS stock has shown a mixed performance based on various technical indicators. The trend indicators suggest a generally positive trend, with moving averages and MACD showing an uptrend. Momentum indicators like RSI and Stochastic oscillators indicate a slightly overbought condition. Volatility indicators show fluctuating price movements within Bollinger Bands. Volume indicators suggest a decrease in buying pressure.
Trend Indicators:
- Moving Averages (MA): The 5-day MA is consistently above the 10-day SMA, indicating a short-term bullish trend.
- MACD: The MACD line is above the signal line, indicating a bullish momentum.
Key Observation: The trend indicators suggest an upward trend in the stock price.
Momentum Indicators:
- RSI: The RSI is around 60, indicating a neutral to slightly overbought condition.
- Stochastic Oscillators: Both %K and %D are in the overbought zone, suggesting a potential reversal.
Key Observation: Momentum indicators show a slightly overbought condition.
Volatility Indicators:
- Bollinger Bands (BB): The stock price has been fluctuating within the bands, indicating price volatility.
Key Observation: Volatility indicators suggest fluctuating price movements within the bands.
Volume Indicators:
- On-Balance Volume (OBV): The OBV has been declining, indicating a decrease in buying pressure.
- Chaikin Money Flow (CMF): The CMF is negative, suggesting a lack of buying interest.
Key Observation: Volume indicators point towards a decrease in buying pressure.
Conclusion:
Based on the analysis of the technical indicators, the next few days' possible stock price movement for MSGS is likely to be sideways to slightly bearish. The trend indicators support an upward movement, but the momentum indicators indicate a potential reversal due to the overbought condition. Volatility indicators suggest fluctuating price movements, and volume indicators show a decrease in buying pressure. Therefore, it is advisable to exercise caution and monitor the stock closely for any signs of a trend reversal or consolidation.
Recommendation:
- Short-term Traders: Consider taking profits or setting tight stop-loss orders due to the overbought momentum signals.
- Long-term Investors: Monitor the stock for a potential pullback to enter at more favorable levels.
Always remember to combine technical analysis with fundamental research and risk management strategies for a well-rounded investment approach.