Technical Analysis of MSM 2024-05-10
Overview:
In analyzing the technical indicators for MSM stock over the last 5 days, we will delve into the trend, momentum, volatility, and volume indicators to provide a comprehensive outlook on the possible stock price movement in the coming days. By examining these key indicators, we aim to offer valuable insights and predictions for informed decision-making.
Trend Indicators:
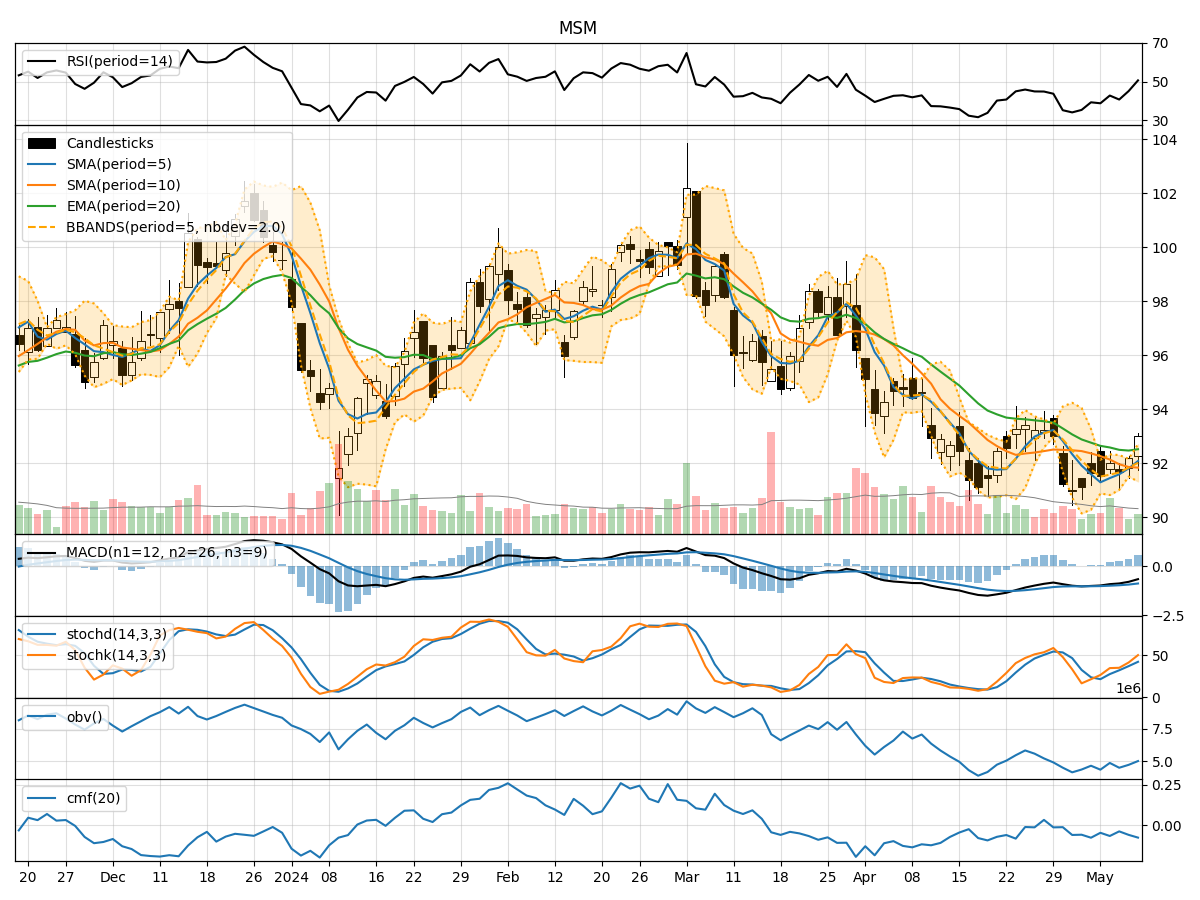
- Moving Averages (MA): The 5-day MA has been fluctuating around the closing prices, indicating short-term price trends. The SMA(10) and EMA(20) show a downward trend, suggesting a bearish sentiment in the medium to long term.
- MACD: The MACD line has been negative, indicating a bearish trend. The MACD Histogram has been decreasing, signaling a weakening bearish momentum.
Momentum Indicators:
- RSI: The RSI has been gradually increasing, indicating a strengthening bullish momentum.
- Stochastic Oscillator: Both %K and %D have been rising, suggesting an upward price momentum.
- Williams %R: The indicator has been moving towards oversold levels, indicating a potential buying opportunity.
Volatility Indicators:
- Bollinger Bands: The bands have been widening, indicating increased volatility in the stock price.
- Bollinger %B: The %B has been fluctuating within the bands, suggesting potential reversal points.
Volume Indicators:
- On-Balance Volume (OBV): The OBV has been declining, indicating selling pressure in the stock.
- Chaikin Money Flow (CMF): The CMF has been negative, suggesting a bearish sentiment in the market.
Key Observations and Opinions:
- Trend: The overall trend is bearish in the medium to long term based on moving averages and MACD.
- Momentum: The momentum indicators show a mixed signal with RSI indicating bullish momentum and Stochastic Oscillator pointing towards a potential uptrend.
- Volatility: Increased volatility as indicated by Bollinger Bands could lead to sharp price movements.
- Volume: The declining OBV and negative CMF suggest a bearish sentiment in the market.
Conclusion:
Based on the analysis of the technical indicators, the stock price of MSM is likely to experience a short-term upward movement due to the bullish signals from momentum indicators like RSI and Stochastic Oscillator. However, the overall trend remains bearish in the medium to long term, supported by moving averages and MACD. Traders should exercise caution and consider the increased volatility in the market while making trading decisions.