Technical Analysis of MT 2024-05-31
Overview:
In the last 5 trading days, the stock price of MT has shown some fluctuations, with a mix of positive and negative movements. By analyzing various technical indicators such as trend, momentum, volatility, and volume, we can gain insights into the possible future price movement of the stock.
Trend Analysis:
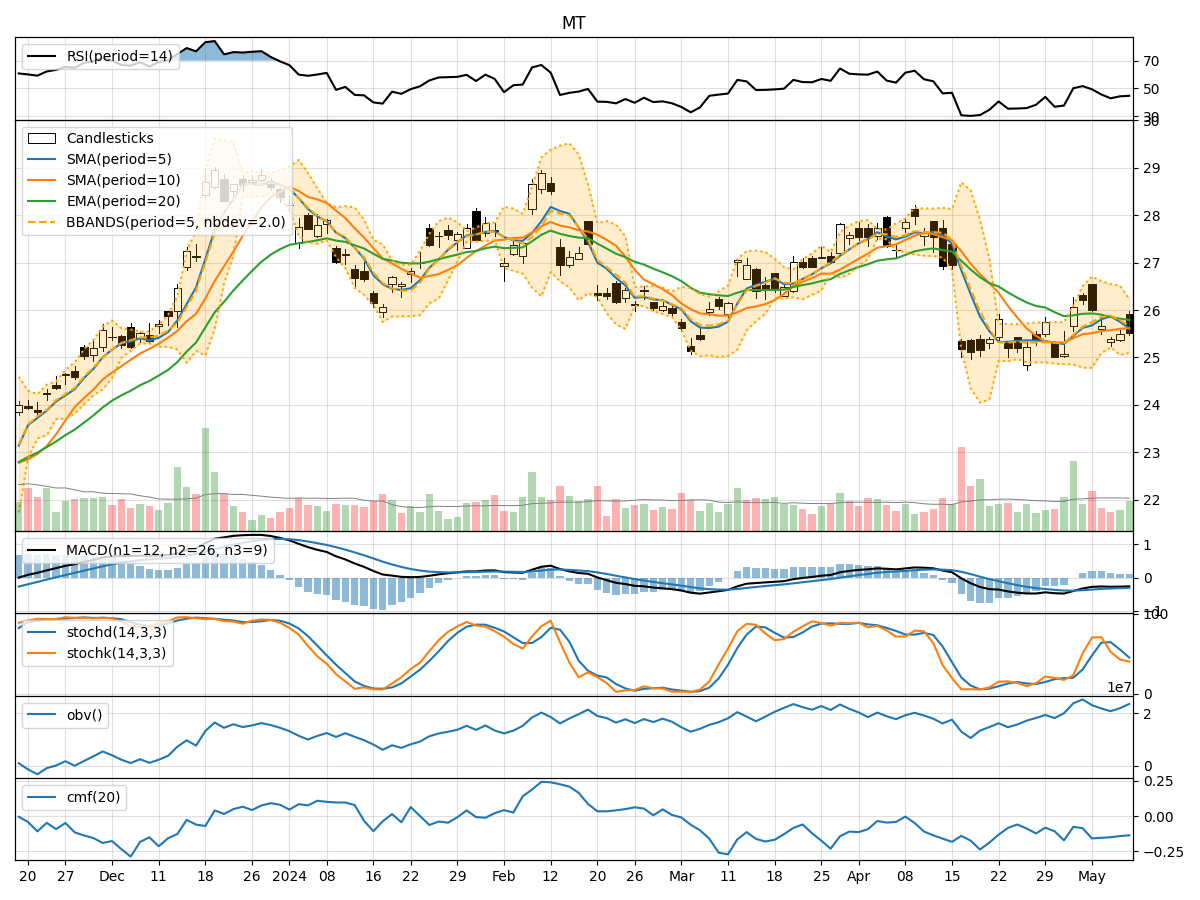
- Moving Averages (MA): The 5-day MA has been fluctuating around the closing prices, indicating short-term price trends. The SMA(10) and EMA(20) have shown some divergence, suggesting potential changes in the trend.
- MACD: The MACD line has been fluctuating around the signal line, with the MACD histogram showing mixed signals. This indicates indecision in the short-term trend direction.
Momentum Analysis:
- RSI: The RSI has been fluctuating around the 50 level, indicating a balanced momentum between buying and selling pressure.
- Stochastic Oscillator: The Stochastics have been moving within the neutral zone, suggesting a lack of strong momentum in either direction.
- Williams %R: The Williams %R has shown oversold conditions on May 29th but has since recovered slightly.
Volatility Analysis:
- Bollinger Bands: The Bollinger Bands have shown narrowing bands, indicating decreasing volatility. The price has been trading within the bands, suggesting a period of consolidation.
- Bollinger %B: The %B indicator has been hovering around 0.5, indicating a balanced market sentiment.
Volume Analysis:
- On-Balance Volume (OBV): The OBV has shown mixed movements, indicating some distribution of the stock.
- Chaikin Money Flow (CMF): The CMF has been negative, suggesting selling pressure in the stock.
Conclusion:
Based on the analysis of the technical indicators: - The stock is currently in a consolidation phase with sideways movement. - The lack of clear trends in the moving averages, mixed signals in the MACD, and neutral momentum indicators suggest a lack of strong directional bias. - The decreasing volatility and mixed volume indicators further support the view of sideways movement. - Overall, the stock is likely to continue trading within a range in the near term without a clear trend in either direction.
Recommendation:
- Short-term traders: Consider range-bound strategies or wait for a clearer trend to emerge before taking positions.
- Long-term investors: Monitor the stock for a potential breakout or breakdown from the consolidation phase before making significant investment decisions.
Disclaimer:
Remember that technical analysis is not a guaranteed predictor of future price movements, and other fundamental factors can influence stock prices. It is essential to conduct thorough research and consider multiple indicators before making any investment decisions. Consulting with a financial advisor can provide tailored insights based on your specific investment goals and risk tolerance level.