Technical Analysis of MTAL 2024-05-10
Overview:
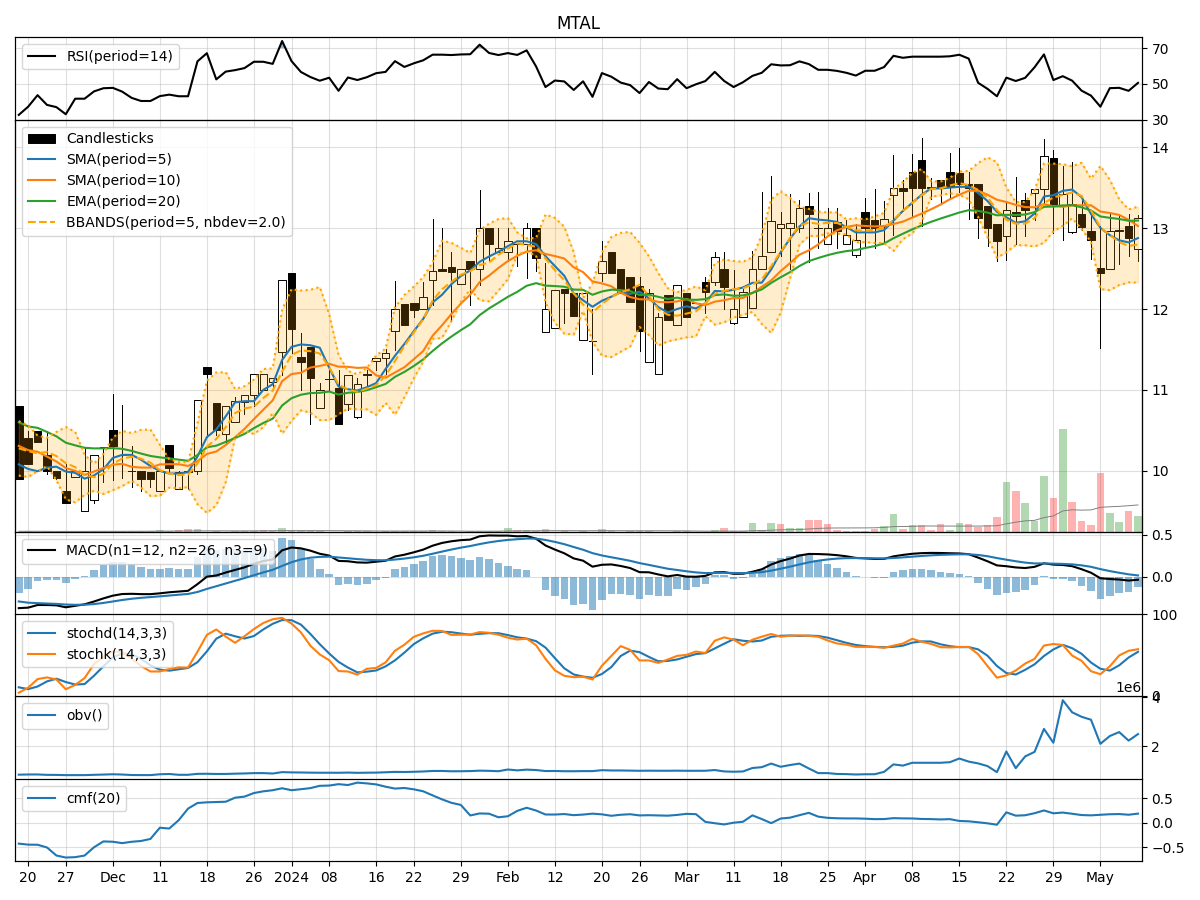
In analyzing the technical indicators for MTAL over the last 5 days, we will delve into the trend, momentum, volatility, and volume indicators to provide a comprehensive outlook on the possible stock price movement in the coming days. By examining these key aspects, we aim to offer valuable insights and predictions for potential investors.
Trend Indicators:
- Moving Averages (MA): The 5-day MA has been consistently below the closing prices, indicating a short-term downtrend.
- MACD: The MACD line has been below the signal line, suggesting a bearish momentum.
- EMA: The EMA has been declining, reflecting a weakening trend.
Momentum Indicators:
- RSI: The RSI has been fluctuating around the 50 level, indicating indecision in the market.
- Stochastic Oscillator: Both %K and %D have been in the overbought territory, signaling a potential reversal.
- Williams %R: The indicator has been hovering around the oversold region, suggesting a possible buying opportunity.
Volatility Indicators:
- Bollinger Bands (BB): The stock price has been trading within the bands, indicating a period of consolidation.
- BB Width: The bands have been narrowing, suggesting a decrease in volatility.
Volume Indicators:
- On-Balance Volume (OBV): The OBV has been fluctuating, indicating mixed buying and selling pressure.
- Chaikin Money Flow (CMF): The CMF has been positive, suggesting a net inflow of money into the stock.
Key Observations:
- The trend indicators point towards a bearish sentiment with declining moving averages and MACD below the signal line.
- Momentum indicators show mixed signals with RSI around 50, stochastic in overbought territory, and Williams %R near oversold levels.
- Volatility indicators indicate a period of consolidation with narrowing Bollinger Bands.
- Volume indicators suggest mixed activity with fluctuating OBV and positive CMF.
Conclusion:
Based on the analysis of the technical indicators, the stock price of MTAL is likely to experience further downside movement in the coming days. The bearish trend, mixed momentum signals, and consolidation pattern in volatility indicators all point towards a potential downward trajectory. Investors should exercise caution and consider waiting for more definitive signals before making any trading decisions.