Technical Analysis of MUSA 2024-05-10
Overview:
In analyzing the technical indicators for MUSA stock over the last 5 days, we will delve into the trend, momentum, volatility, and volume indicators to provide a comprehensive outlook on the possible stock price movement in the coming days. By examining these key indicators, we aim to offer valuable insights and predictions for informed decision-making.
Trend Analysis:
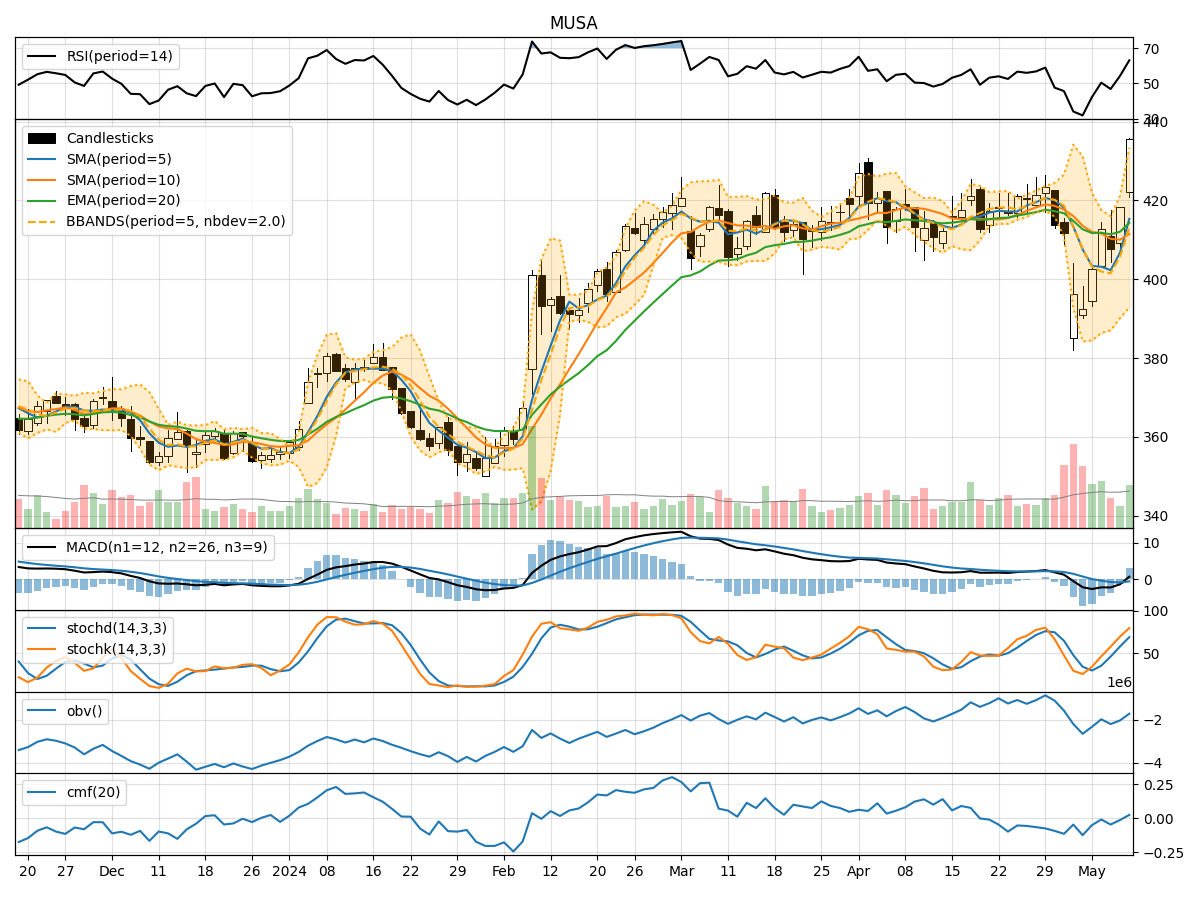
- Moving Averages (MA): The 5-day Moving Average (MA) has been fluctuating around the closing prices, indicating short-term price trends. The Simple Moving Average (SMA) and Exponential Moving Average (EMA) show a slight downward trend, suggesting a potential bearish sentiment.
- MACD: The Moving Average Convergence Divergence (MACD) has been negative, with the MACD line below the signal line. This indicates a bearish momentum in the stock price.
- Conclusion: The trend indicators suggest a bearish outlook for MUSA stock in the near term.
Momentum Analysis:
- RSI: The Relative Strength Index (RSI) has been increasing, reaching above 50, indicating a strengthening momentum in the stock price.
- Stochastic Oscillator: Both %K and %D lines of the Stochastic Oscillator are in the overbought zone, suggesting a potential reversal in the price trend.
- Conclusion: The momentum indicators signal a mixed sentiment, with a possibility of a short-term correction in the stock price.
Volatility Analysis:
- Bollinger Bands: The Bollinger Bands show an expanding range, indicating increased volatility in the stock price. The price has been moving towards the upper band, suggesting a bullish momentum.
- Conclusion: The volatility indicators point towards increased volatility and a bullish bias in the stock price movement.
Volume Analysis:
- On-Balance Volume (OBV): The OBV has been fluctuating, indicating indecision among investors regarding the stock.
- Chaikin Money Flow (CMF): The CMF has been negative, reflecting selling pressure in the stock.
- Conclusion: The volume indicators suggest a neutral to bearish sentiment among investors.
Overall Conclusion:
Based on the analysis of trend, momentum, volatility, and volume indicators, the overall outlook for MUSA stock in the next few days is bearish with a potential short-term correction. The trend indicators indicate a bearish sentiment, while the momentum indicators show mixed signals with a possibility of a correction. The volatility indicators point towards increased volatility with a bullish bias, and the volume indicators suggest a neutral to bearish sentiment among investors.
Recommendation:
Considering the comprehensive analysis of technical indicators, it is advisable to exercise caution in trading MUSA stock in the coming days. Investors may consider short-term profit-taking strategies or hedging their positions to mitigate potential downside risks. Monitoring key support and resistance levels along with market developments is crucial for making informed trading decisions.
Disclaimer:
This analysis is based solely on technical indicators and historical data, and it is important to consider other fundamental factors and market dynamics before making investment decisions. It is recommended to consult with a financial advisor or conduct further research before taking any trading actions.