Technical Analysis of MYTE 2024-05-10
Overview:
In analyzing the technical indicators for MYTE stock over the last 5 days, we will delve into the trend, momentum, volatility, and volume indicators to provide a comprehensive outlook on the possible stock price movement in the coming days. By examining these key indicators, we aim to offer valuable insights and predictions for potential investors.
Trend Analysis:
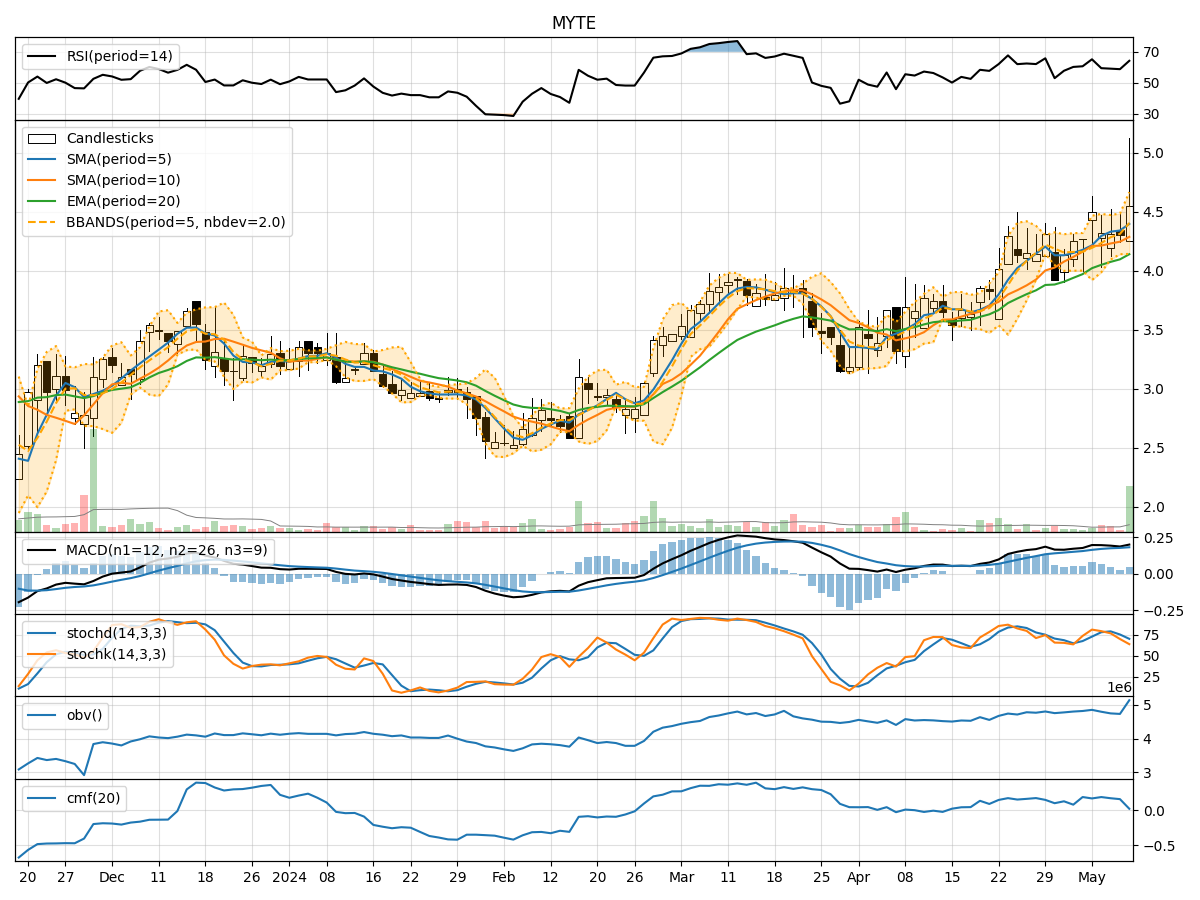
- Moving Averages (MA): The 5-day Moving Average (MA) has been consistently above the Simple Moving Average (SMA) and Exponential Moving Average (EMA), indicating a bullish trend.
- MACD: The Moving Average Convergence Divergence (MACD) has shown positive values, with the MACD line consistently above the Signal line, suggesting bullish momentum.
Momentum Analysis:
- RSI: The Relative Strength Index (RSI) has been fluctuating around the 60-65 range, indicating a neutral to slightly bullish momentum.
- Stochastic Oscillator: Both %K and %D have been declining, suggesting a weakening bullish momentum.
Volatility Analysis:
- Bollinger Bands (BB): The stock price has been trading within the Bollinger Bands, with the bands widening slightly, indicating increased volatility.
Volume Analysis:
- On-Balance Volume (OBV): The OBV has shown a slight increase over the last 5 days, indicating accumulation by investors.
- Chaikin Money Flow (CMF): The CMF has been positive but decreasing, suggesting a potential weakening of buying pressure.
Key Observations:
- The trend indicators point towards a bullish sentiment, supported by the positive MACD values and the MA positioning.
- Momentum indicators show a mixed signal, with RSI indicating a neutral stance while the Stochastic Oscillator suggests a weakening bullish momentum.
- Volatility has slightly increased, as seen in the widening Bollinger Bands, indicating potential price fluctuations.
- Volume indicators reflect a slight increase in buying pressure, as evidenced by the rising OBV, although the CMF shows a potential decrease in buying strength.
Conclusion:
Based on the analysis of the technical indicators, the stock price of MYTE is likely to experience a short-term consolidation phase. The bullish trend indicated by the moving averages and MACD may face resistance due to the weakening momentum shown by the Stochastic Oscillator. The increased volatility suggests potential price swings within a range, while the volume indicators point towards a moderate buying interest.
Recommendation:
- Short-term Traders: Consider taking profits or tightening stop-loss levels during the consolidation phase.
- Long-term Investors: Monitor the price action for a potential entry point during a pullback or consolidation before considering adding to positions.
Disclaimer:
Remember that market conditions can change rapidly, and it is essential to conduct further analysis and consider other factors before making investment decisions. Consult with a financial advisor to align your investment strategy with your financial goals and risk tolerance.