Technical Analysis of NATL 2024-05-10
Overview:
In analyzing the technical indicators for NATL over the last 5 days, we will delve into the trend, momentum, volatility, and volume indicators to provide a comprehensive outlook on the possible stock price movement in the coming days. By examining these key indicators, we aim to offer valuable insights and recommendations for potential investors.
Trend Indicators:
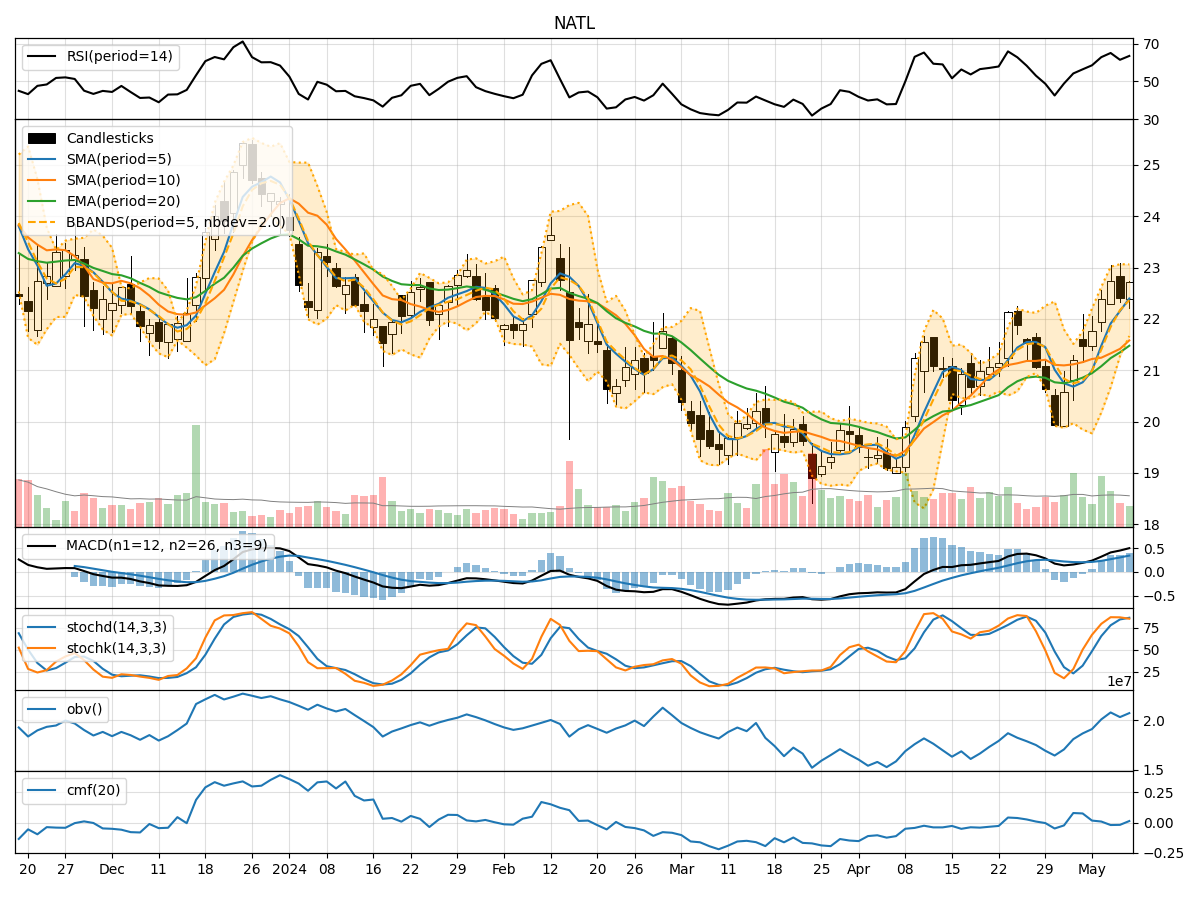
- Moving Averages (MA): The 5-day Moving Average (MA) has been consistently above the Simple Moving Average (SMA) and Exponential Moving Average (EMA), indicating a bullish trend.
- MACD: The MACD line has been consistently above the signal line, with both lines showing an upward trend, suggesting bullish momentum.
- RSI: The Relative Strength Index (RSI) has been fluctuating around the overbought territory, indicating strong buying pressure.
Momentum Indicators:
- Stochastic Oscillator: Both %K and %D lines of the Stochastic Oscillator have been in the overbought zone, suggesting a potential reversal or consolidation.
- Williams %R: The Williams %R has been hovering in the oversold territory, indicating a possible buying opportunity.
Volatility Indicators:
- Bollinger Bands (BB): The stock price has been trading within the upper Bollinger Band, indicating an overbought condition.
- Bollinger Band Width: The Band Width has been narrowing, suggesting a potential decrease in volatility.
Volume Indicators:
- On-Balance Volume (OBV): The OBV has shown mixed signals, indicating indecision among investors.
- Chaikin Money Flow (CMF): The CMF has been fluctuating around the zero line, reflecting a neutral stance on money flow.
Key Observations and Opinions:
- Trend: The trend indicators suggest a strong bullish sentiment in the short term.
- Momentum: The momentum indicators show signs of potential reversal or consolidation due to overbought conditions.
- Volatility: Volatility has been decreasing, indicating a possible period of consolidation or sideways movement.
- Volume: Volume indicators reflect mixed signals, pointing towards uncertainty in market participation.
Conclusion:
Based on the analysis of the technical indicators, the next few days' possible stock price movement for NATL is likely to experience a short-term consolidation or pullback. The overbought conditions in momentum indicators and narrowing volatility suggest a potential pause in the recent bullish trend. Investors should exercise caution and consider waiting for clearer signals before making significant trading decisions.