Technical Analysis of NBR 2024-05-10
Overview:
In analyzing the technical indicators for NBR over the last 5 days, we will delve into the trend, momentum, volatility, and volume indicators to provide a comprehensive outlook on the possible stock price movement in the coming days. By examining these key aspects, we aim to offer valuable insights and recommendations for potential investors.
Trend Analysis:
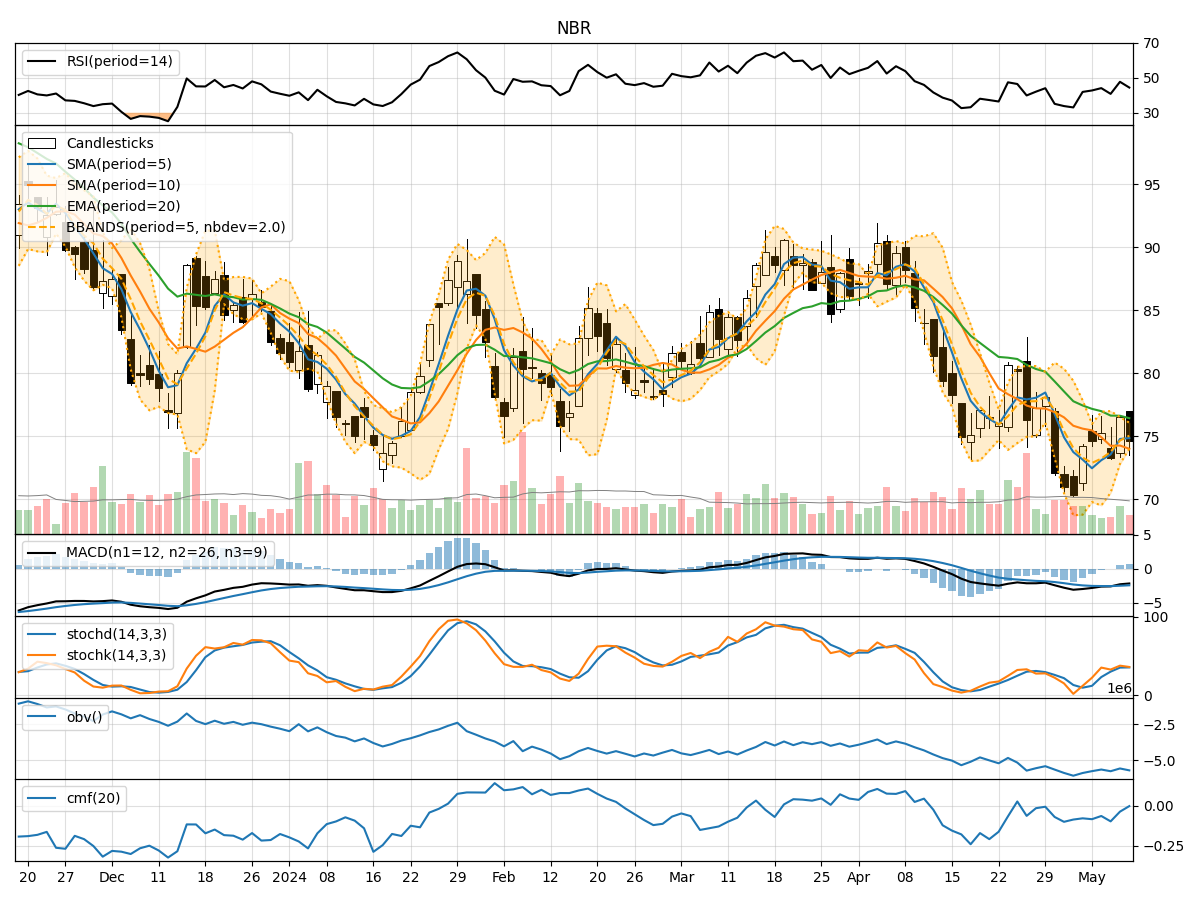
- Moving Averages (MA): The 5-day Moving Average (MA) has been fluctuating around the closing prices, indicating short-term price trends. The Simple Moving Average (SMA) and Exponential Moving Average (EMA) show a downward trend, suggesting a bearish sentiment in the short to mid-term.
- MACD: The Moving Average Convergence Divergence (MACD) is negative, with the MACD line below the signal line, indicating a bearish trend in momentum.
Momentum Analysis:
- RSI: The Relative Strength Index (RSI) is below 50, indicating a bearish momentum in the stock.
- Stochastic Oscillator: Both %K and %D are below 50, suggesting a bearish sentiment in momentum.
- Williams %R: The Williams %R is in the oversold territory, indicating a potential reversal or continuation of the bearish trend.
Volatility Analysis:
- Bollinger Bands (BB): The stock price has been trading within the lower Bollinger Band, indicating a potential oversold condition. The bands are narrowing, suggesting a decrease in volatility.
Volume Analysis:
- On-Balance Volume (OBV): The OBV has been declining, indicating selling pressure in the stock.
- Chaikin Money Flow (CMF): The CMF is negative, suggesting a bearish sentiment in the stock based on both price and volume.
Key Observations:
- The trend indicators show a bearish sentiment in the short to mid-term.
- Momentum indicators also support a bearish outlook, with RSI, Stochastic Oscillator, and Williams %R signaling downward momentum.
- Volatility is decreasing, indicating a potential stabilization in price movements.
- Volume indicators suggest selling pressure and a bearish sentiment in the stock.
Conclusion:
Based on the analysis of the technical indicators, the overall outlook for NBR in the next few days is bearish. The stock is likely to experience further downward pressure, with a potential continuation of the current downtrend. Investors should exercise caution and consider waiting for more favorable technical signals before considering any long positions.