Technical Analysis of NEP 2024-05-10
Overview:
In analyzing the technical indicators for NEP over the last 5 days, we will delve into the trend, momentum, volatility, and volume indicators to provide a comprehensive outlook on the possible stock price movement in the coming days. By examining these key indicators, we aim to offer valuable insights and predictions for informed decision-making.
Trend Analysis:
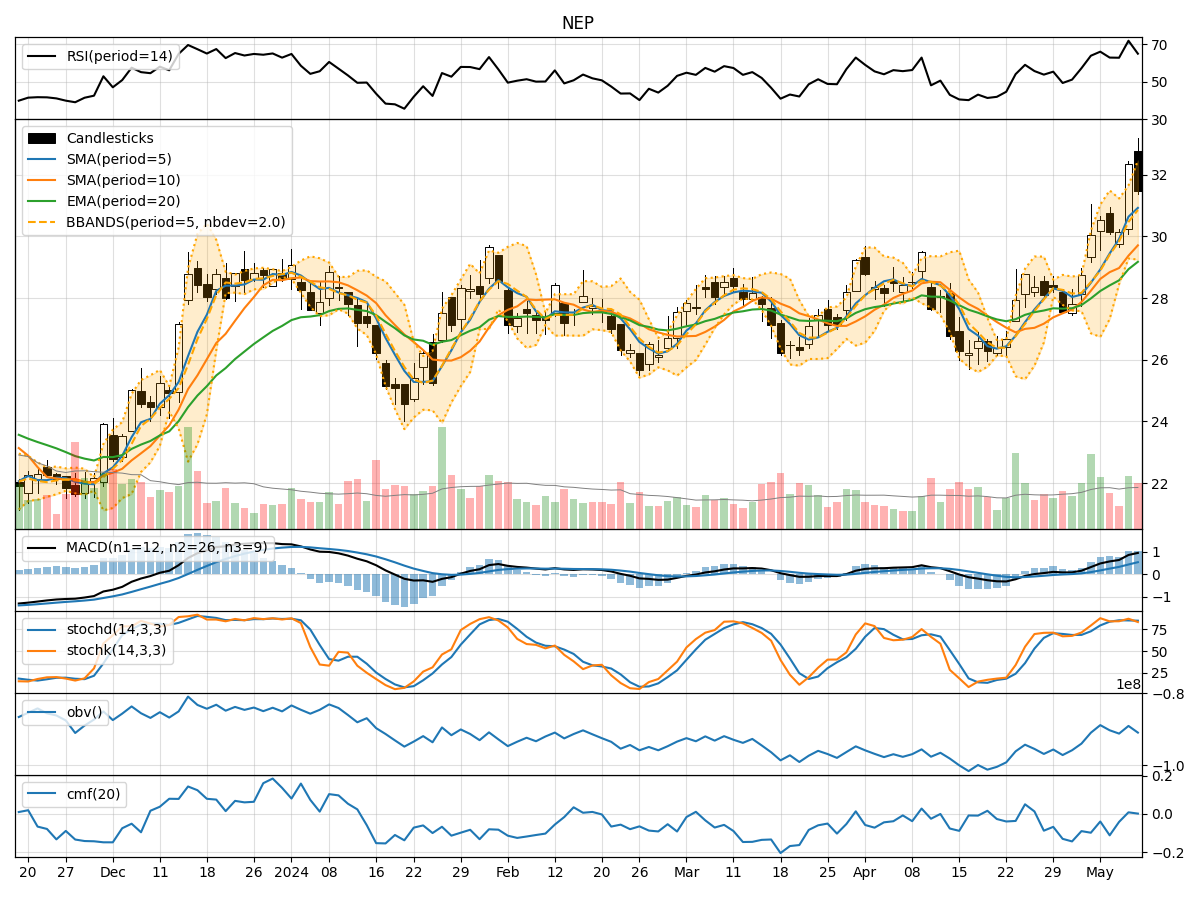
- Moving Averages (MA): The 5-day Moving Average (MA) has been consistently above the longer-term Simple Moving Average (SMA) and Exponential Moving Average (EMA), indicating a bullish trend.
- MACD: The Moving Average Convergence Divergence (MACD) has shown positive values, with the MACD line consistently above the Signal line, suggesting bullish momentum.
Momentum Analysis:
- RSI: The Relative Strength Index (RSI) has been fluctuating but generally above 50, indicating bullish momentum.
- Stochastic Oscillator: Both %K and %D have been in the overbought zone, suggesting a potential reversal or consolidation.
Volatility Analysis:
- Bollinger Bands (BB): The stock price has mostly stayed within the Bollinger Bands, with the %B indicator hovering around 0.5, indicating a neutral stance.
Volume Analysis:
- On-Balance Volume (OBV): The OBV has shown mixed signals, with no clear trend in volume accumulation or distribution.
- Chaikin Money Flow (CMF): The CMF has been negative, indicating some selling pressure in the stock.
Key Observations:
- The trend indicators suggest a bullish sentiment, supported by the moving averages and MACD.
- Momentum indicators show mixed signals, with RSI indicating bullish momentum but Stochastic Oscillator signaling potential overbought conditions.
- Volatility remains relatively stable, with the stock price mostly trading within the Bollinger Bands.
- Volume indicators do not provide a clear direction, with OBV showing mixed signals and CMF indicating some selling pressure.
Conclusion:
Based on the analysis of the technical indicators, the next few days' possible stock price movement for NEP is likely to be sideways with a slight bullish bias. While the trend indicators point towards a bullish sentiment, the mixed signals from momentum and volume indicators suggest a potential consolidation phase. Traders should closely monitor key levels and wait for clearer signals before making significant trading decisions.