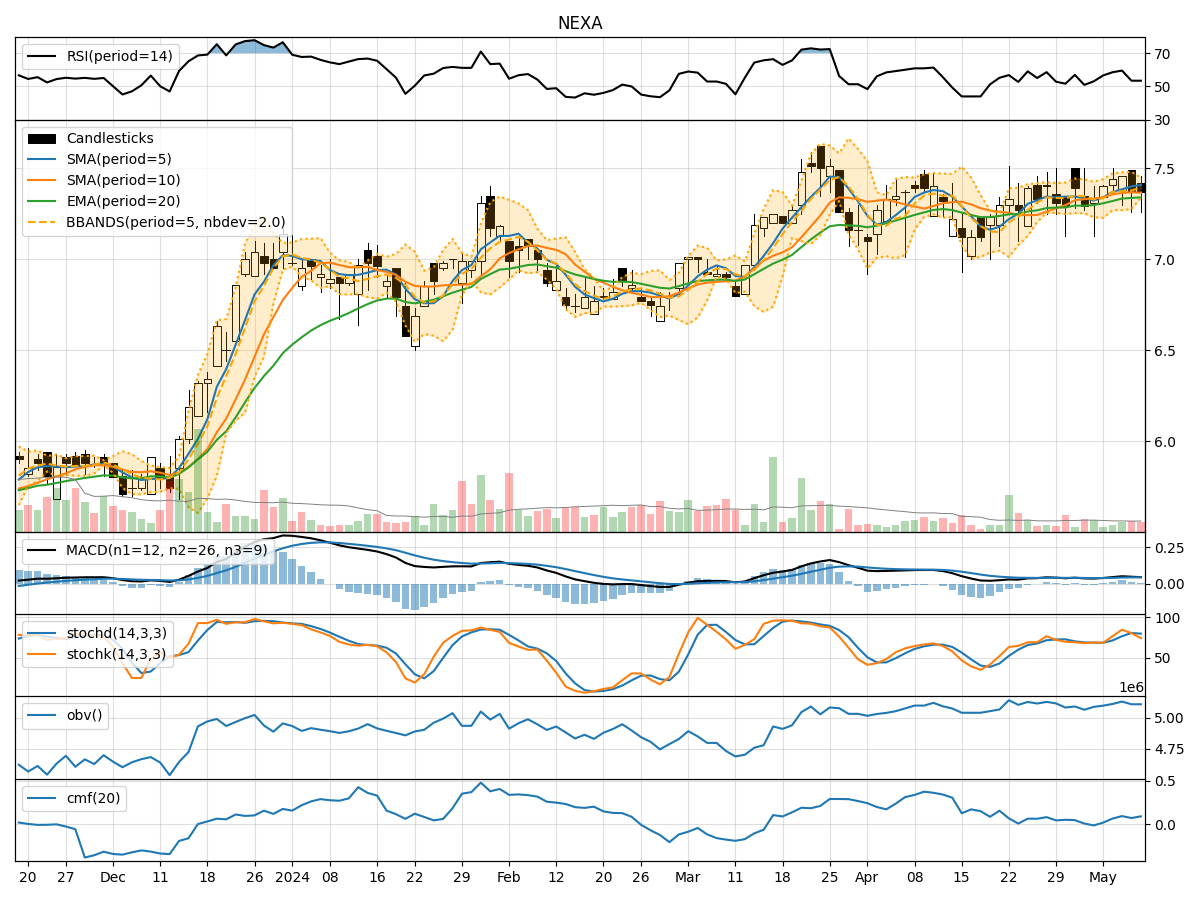
Technical Analysis of NEXA 2024-05-10
Overview:
In analyzing the technical indicators for NEXA stock over the last 5 days, we will delve into the trend, momentum, volatility, and volume indicators to provide insights into the possible future stock price movement. By examining these key aspects, we aim to offer a comprehensive analysis and make informed predictions for the upcoming trading days.
Trend Indicators:
- Moving Averages (MA): The 5-day Moving Average (MA) has been consistently above the closing price, indicating a short-term bullish trend.
- MACD: The Moving Average Convergence Divergence (MACD) has shown positive values, suggesting a bullish momentum in the stock price.
- EMA: The Exponential Moving Average (EMA) has been trending upwards, supporting the bullish sentiment in the short to medium term.
Momentum Indicators:
- RSI: The Relative Strength Index (RSI) has been fluctuating around the neutral zone, indicating a balanced momentum in the stock.
- Stochastic Oscillator: Both %K and %D values have been relatively high, suggesting a bullish momentum in the stock.
- Williams %R: The Williams %R indicator has been in the oversold territory, signaling a potential buying opportunity.
Volatility Indicators:
- Bollinger Bands: The Bollinger Bands have shown a narrowing of the bands, indicating decreasing volatility in the stock price.
- Bollinger %B: The %B indicator has been hovering around the middle range, reflecting a neutral stance in terms of volatility.
Volume Indicators:
- On-Balance Volume (OBV): The OBV has shown mixed signals, with no clear trend in volume accumulation or distribution.
- Chaikin Money Flow (CMF): The CMF has been positive, suggesting a potential inflow of money into the stock.
Key Observations and Opinions:
- Trend: The trend indicators point towards a bullish sentiment in the short to medium term, supported by moving averages and MACD.
- Momentum: The momentum indicators suggest a mixed sentiment, with RSI and Williams %R indicating a neutral stance, while the Stochastic Oscillator leans towards a bullish momentum.
- Volatility: Volatility has been decreasing, as indicated by the narrowing Bollinger Bands, which could lead to a period of consolidation or a potential breakout.
- Volume: Volume indicators show mixed signals, with OBV lacking a clear trend and CMF indicating a positive money flow into the stock.
Conclusion:
Based on the analysis of the technical indicators, the stock price of NEXA is likely to experience sideways movement in the upcoming trading days. The bullish trend indicated by moving averages and MACD may be offset by the neutral momentum and mixed volume signals. The decreasing volatility suggests a period of consolidation, with the potential for a breakout in either direction. Traders should closely monitor key support and resistance levels for potential entry or exit points.