Technical Analysis of NHI 2024-05-10
Overview:
In analyzing the technical indicators for NHI over the last 5 days, we will delve into the trend, momentum, volatility, and volume indicators to provide a comprehensive outlook on the possible stock price movement in the coming days. By examining these key aspects, we aim to offer valuable insights and recommendations for potential investors.
Trend Indicators:
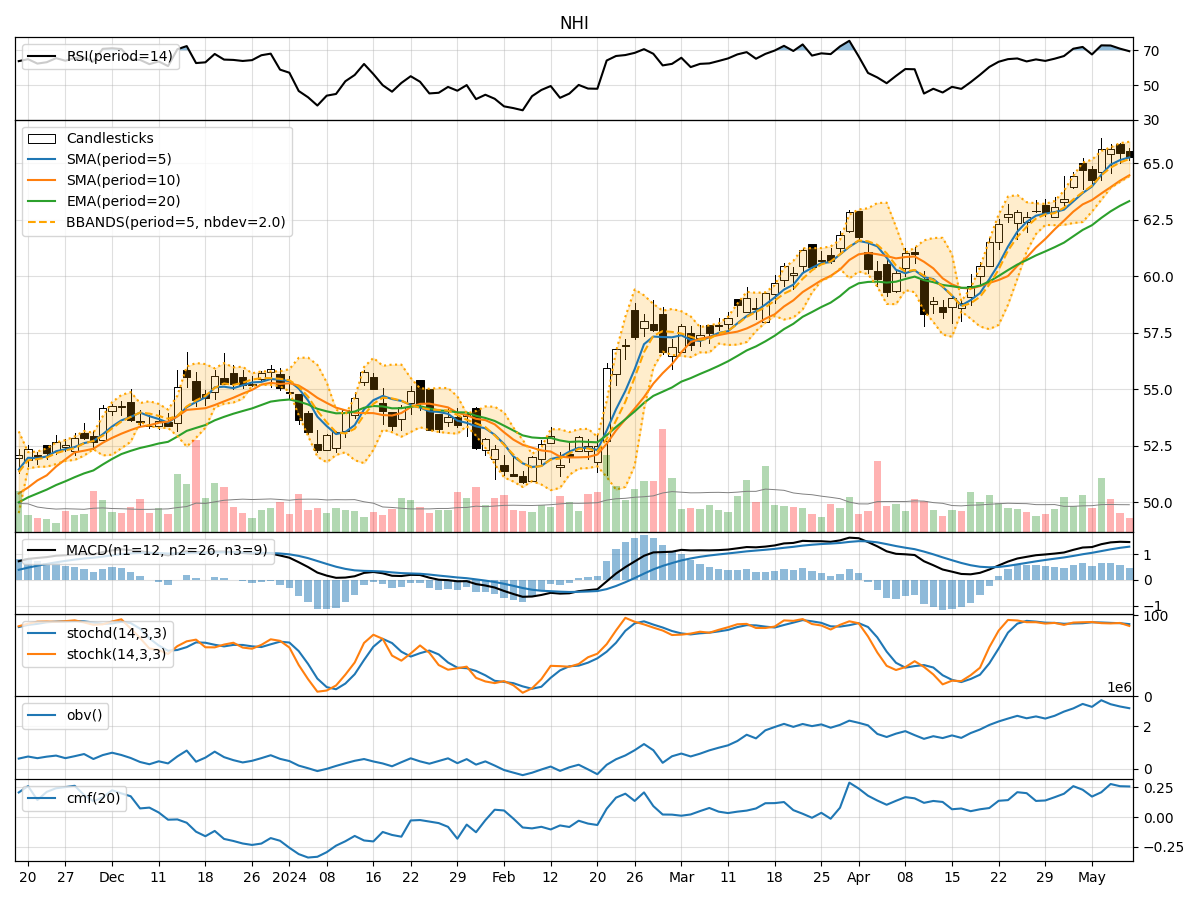
- Moving Averages (MA): The 5-day moving average has been consistently above the 10-day simple moving average, indicating a short-term bullish trend.
- MACD: The MACD line has been above the signal line for the past 5 days, suggesting positive momentum in the stock price.
Momentum Indicators:
- RSI: The Relative Strength Index has been in the overbought territory, indicating a strong bullish momentum.
- Stochastic Oscillator: Both %K and %D have been relatively high, signaling an overbought condition.
Volatility Indicators:
- Bollinger Bands: The stock price has been trading within the upper Bollinger Band, suggesting an increased volatility and potential for a pullback.
Volume Indicators:
- On-Balance Volume (OBV): The OBV has shown a slight increase over the last 5 days, indicating accumulation by investors.
- Chaikin Money Flow (CMF): The CMF has been positive, reflecting buying pressure in the stock.
Key Observations and Opinions:
- Trend: The stock is in a short-term bullish trend based on moving averages and MACD.
- Momentum: The momentum indicators suggest a strong bullish sentiment, but the overbought conditions may lead to a potential reversal.
- Volatility: The stock has exhibited increased volatility, which could result in a pullback or consolidation.
- Volume: The volume indicators show a slight increase in buying pressure, supporting the bullish outlook.
Conclusion:
Based on the analysis of the technical indicators, the next few days' possible stock price movement for NHI is likely to experience a short-term pullback or consolidation due to the overbought conditions indicated by the momentum indicators and the increased volatility. Investors should exercise caution and consider waiting for a better entry point before initiating new positions.