Technical Analysis of NIC 2024-05-10
Overview:
In analyzing the technical indicators for NIC stock over the last 5 days, we will delve into the trend, momentum, volatility, and volume indicators to provide a comprehensive outlook on the possible stock price movement in the coming days. By examining these key indicators, we aim to offer valuable insights and predictions for potential investors.
Trend Analysis:
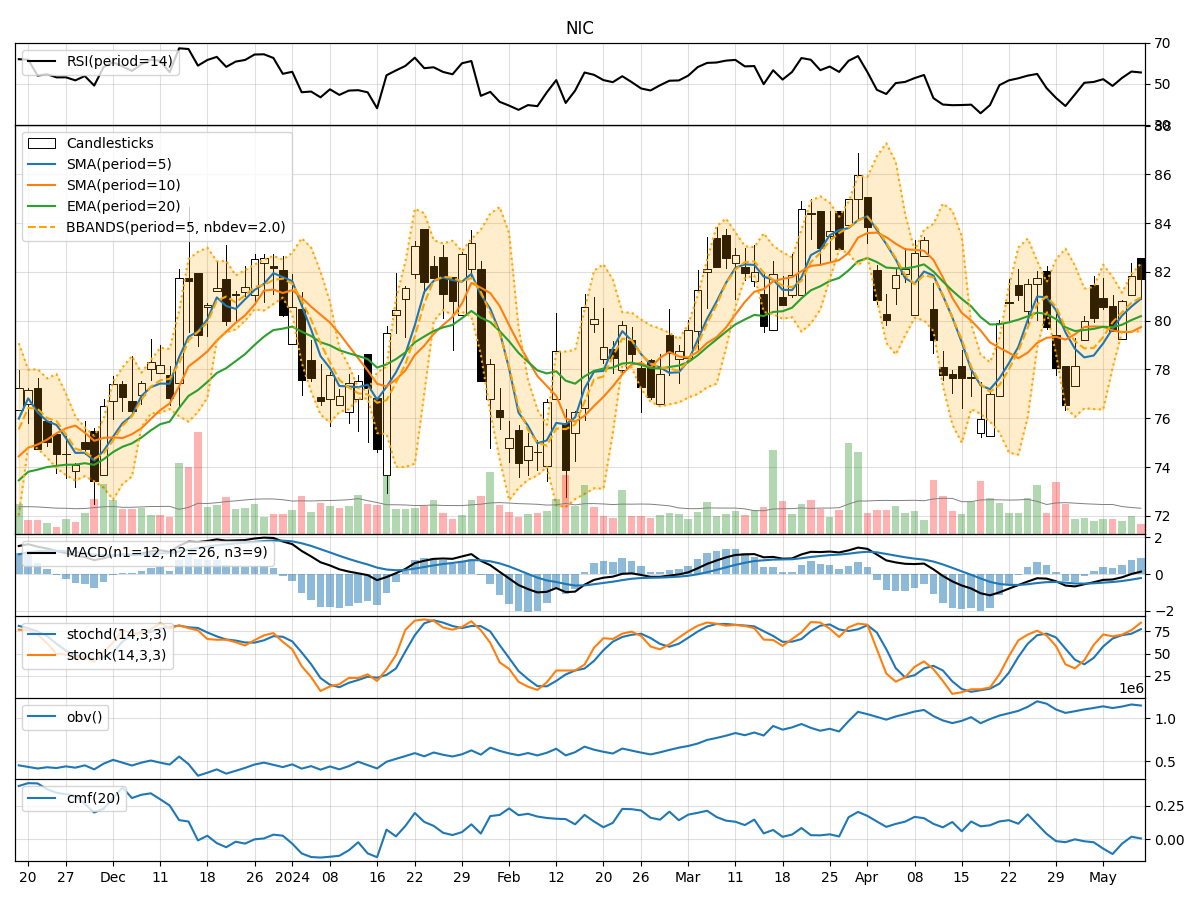
- Moving Averages (MA): The 5-day moving average (MA) has been trending upwards, indicating a positive short-term momentum in the stock price.
- MACD: The MACD line has been consistently above the signal line, suggesting a bullish trend in the stock.
- Relative Strength Index (RSI): The RSI values have been fluctuating around the neutral zone, indicating a balanced buying and selling pressure.
Momentum Analysis:
- Stochastic Oscillator: The stochastic indicators have been in the overbought territory, suggesting a potential reversal or consolidation phase.
- Williams %R (WillR): The Williams %R values have been fluctuating, indicating a mixed sentiment among traders.
Volatility Analysis:
- Bollinger Bands (BB): The Bollinger Bands have been relatively narrow, indicating low volatility in the stock price movement.
- Bollinger Band %B (BBP): The %B values have been hovering around the midline, suggesting a lack of strong directional bias.
Volume Analysis:
- On-Balance Volume (OBV): The OBV values have shown a slight increase, indicating a potential accumulation of the stock by investors.
- Chaikin Money Flow (CMF): The CMF values have been negative, signaling a slight outflow of money from the stock.
Key Observations:
- The trend indicators suggest a bullish sentiment in the short term.
- Momentum indicators point towards a potential reversal or consolidation phase.
- Volatility indicators indicate low volatility and a lack of strong directional bias.
- Volume indicators show a slight increase in accumulation but a negative money flow.
Conclusion:
Based on the analysis of the technical indicators, the stock price of NIC is likely to experience a period of consolidation in the coming days. Traders should exercise caution and closely monitor the price action for any signs of a breakout or reversal. It is advisable to wait for clearer signals before making any significant trading decisions.