Technical Analysis of NLY 2024-05-10
Overview:
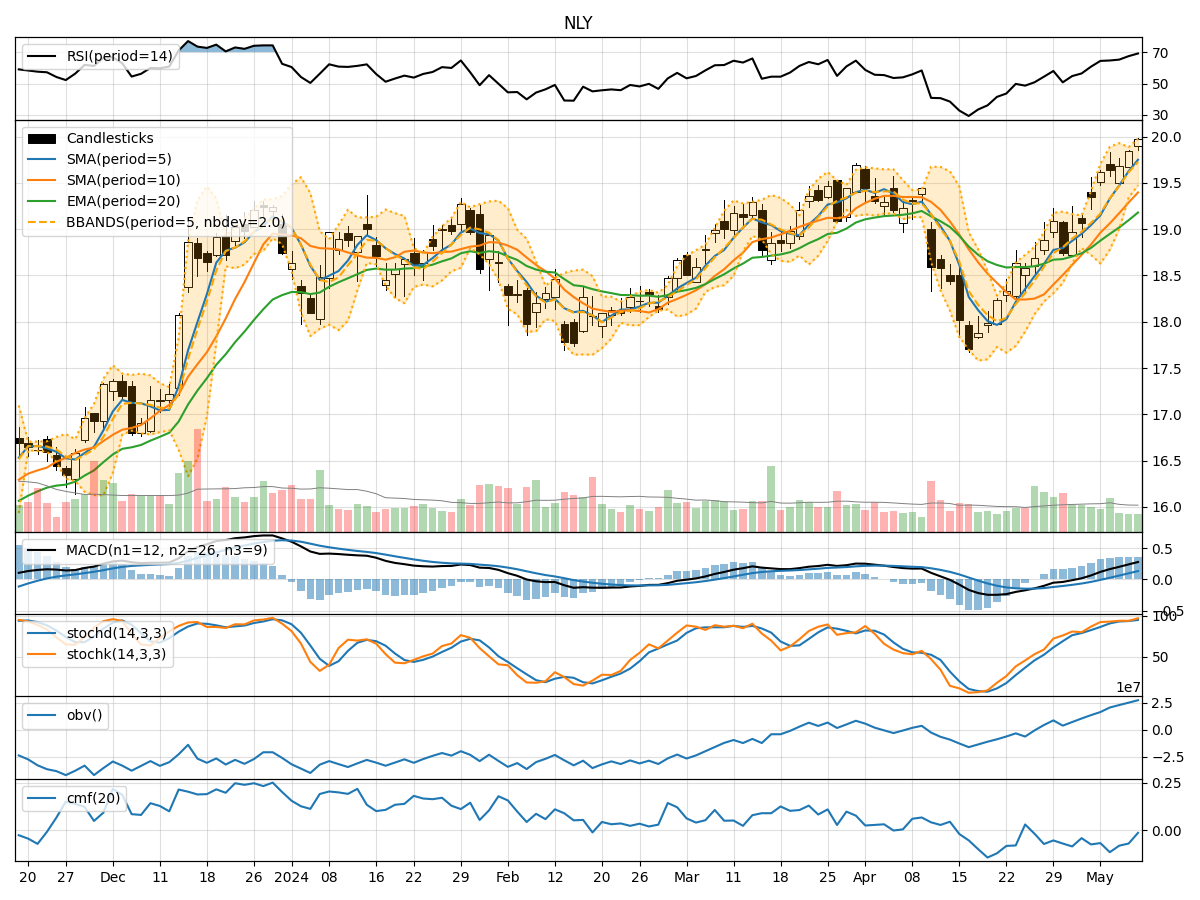
In the last 5 trading days, NLY stock has shown a consistent uptrend in both price and volume. The moving averages have been steadily increasing, indicating a bullish trend. Momentum indicators such as RSI and Stochastic oscillators suggest the stock is in overbought territory but still showing strength. Volatility indicators like Bollinger Bands show a narrowing range, potentially signaling a period of consolidation. Volume indicators have been relatively stable, with no significant divergence.
Trend Analysis:
- Moving Averages (MA): The 5-day MA has been consistently above the longer-term SMAs, indicating a bullish trend. The EMA has also been trending upwards, supporting the bullish sentiment.
- MACD: The MACD line has been above the signal line for the past 5 days, with both lines trending upwards. The MACD histogram has been increasing, indicating strengthening bullish momentum.
Momentum Analysis:
- RSI: The RSI has been in the overbought territory, suggesting a potential pullback or consolidation in the near future.
- Stochastic Oscillators: Both %K and %D lines have been in the overbought zone, indicating a strong upward momentum. However, caution is advised as the stock may be due for a correction.
Volatility Analysis:
- Bollinger Bands: The Bollinger Bands have been narrowing, indicating decreasing volatility and a potential period of consolidation. A breakout in either direction may occur soon.
Volume Analysis:
- On-Balance Volume (OBV): The OBV has been steadily increasing, reflecting accumulation by investors. This is a positive sign supporting the uptrend.
- Chaikin Money Flow (CMF): The CMF has been negative but relatively stable, indicating some selling pressure. However, it is not significant enough to reverse the overall bullish trend.
Conclusion:
Based on the technical indicators analyzed, the next few days for NLY stock are likely to see further upward movement in price. The trend indicators, momentum indicators, and volume indicators all point towards a continuation of the bullish trend. However, given the overbought conditions indicated by the RSI and Stochastic oscillators, a short-term correction or consolidation cannot be ruled out. Traders should monitor the Bollinger Bands for a potential breakout signal. Overall, the outlook for NLY stock remains bullish in the near term.