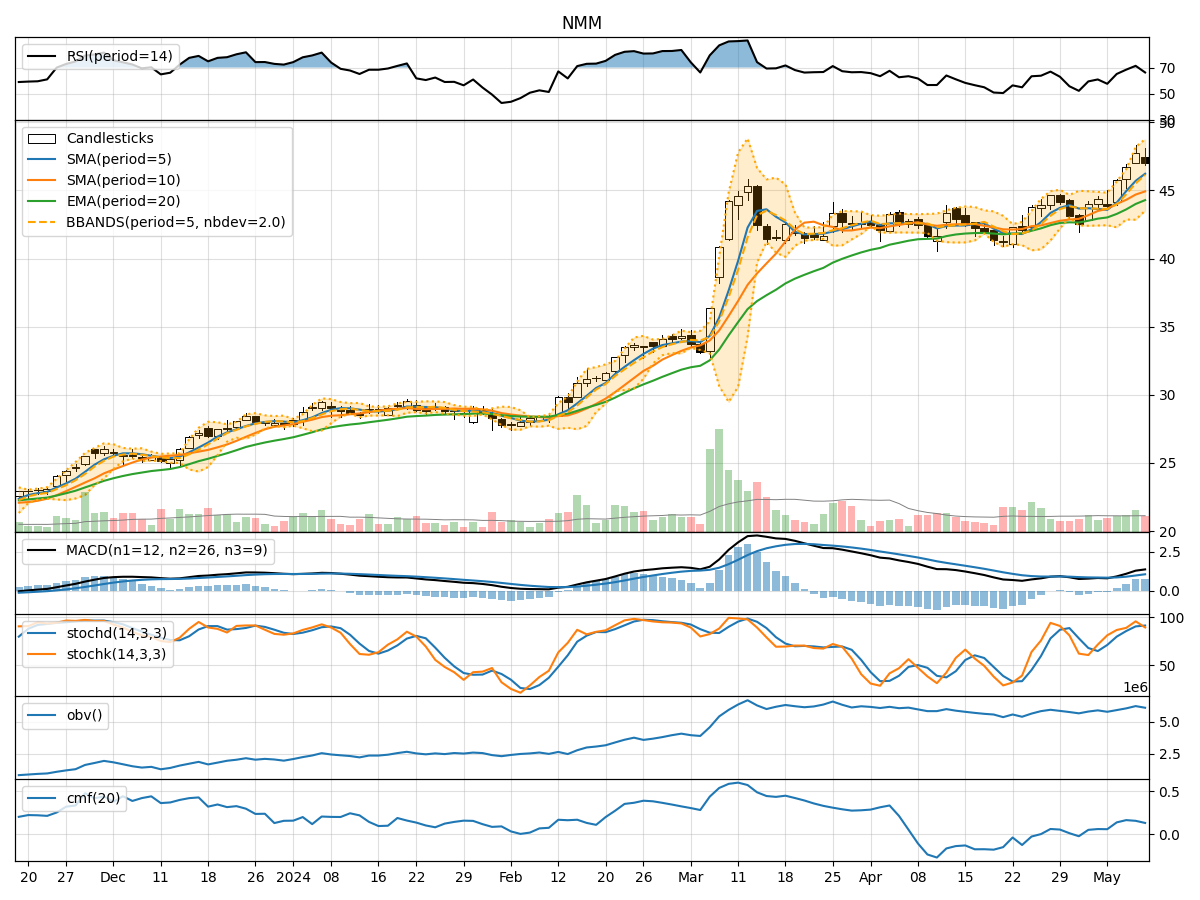
Technical Analysis of NMM 2024-05-10
Overview:
In analyzing the technical indicators for NMM over the last 5 days, we will delve into the trend, momentum, volatility, and volume indicators to provide a comprehensive outlook on the possible stock price movement in the coming days. By examining these key indicators, we aim to offer valuable insights and predictions for informed decision-making.
Trend Indicators:
- Moving Averages (MA): The 5-day MA has been consistently above the closing prices, indicating a bullish trend.
- MACD: The MACD line has been above the signal line, suggesting a bullish momentum.
- RSI: The RSI values have been increasing, reflecting strengthening bullish momentum.
Momentum Indicators:
- Stochastic Oscillator: Both %K and %D have been in the overbought zone, signaling a potential reversal or consolidation.
- Williams %R: The indicator has been in the oversold territory, indicating a possible bullish reversal.
Volatility Indicators:
- Bollinger Bands: The stock price has been trading near the upper band, suggesting high volatility and a potential overbought condition.
- BB%: The %B indicator has been above 0.8, indicating a potential overbought situation.
Volume Indicators:
- On-Balance Volume (OBV): The OBV has been increasing, indicating accumulation by investors.
- Chaikin Money Flow (CMF): The CMF has been positive, suggesting buying pressure in the stock.
Key Observations:
- The trend indicators point towards a bullish sentiment with moving averages and MACD signaling upward momentum.
- Momentum indicators show potential overbought conditions, indicating a need for caution.
- Volatility indicators suggest high volatility and a possible overbought scenario.
- Volume indicators reflect positive accumulation and buying pressure in the stock.
Conclusion:
Based on the analysis of the technical indicators, the next few days' possible stock price movement for NMM is likely to experience a short-term pullback or consolidation. The stock has shown signs of being overbought, as indicated by the momentum and volatility indicators. Investors should exercise caution and consider potential profit-taking opportunities in the near future. Overall, the outlook remains bullish in the longer term, but a temporary correction or sideways movement can be expected in the coming days.