Technical Analysis of NNN 2024-05-10
Overview:
In analyzing the technical indicators for NNN over the last 5 days, we will delve into the trend, momentum, volatility, and volume indicators to provide a comprehensive outlook on the possible stock price movement. By examining these key aspects, we aim to offer valuable insights and predictions for the upcoming days.
Trend Analysis:
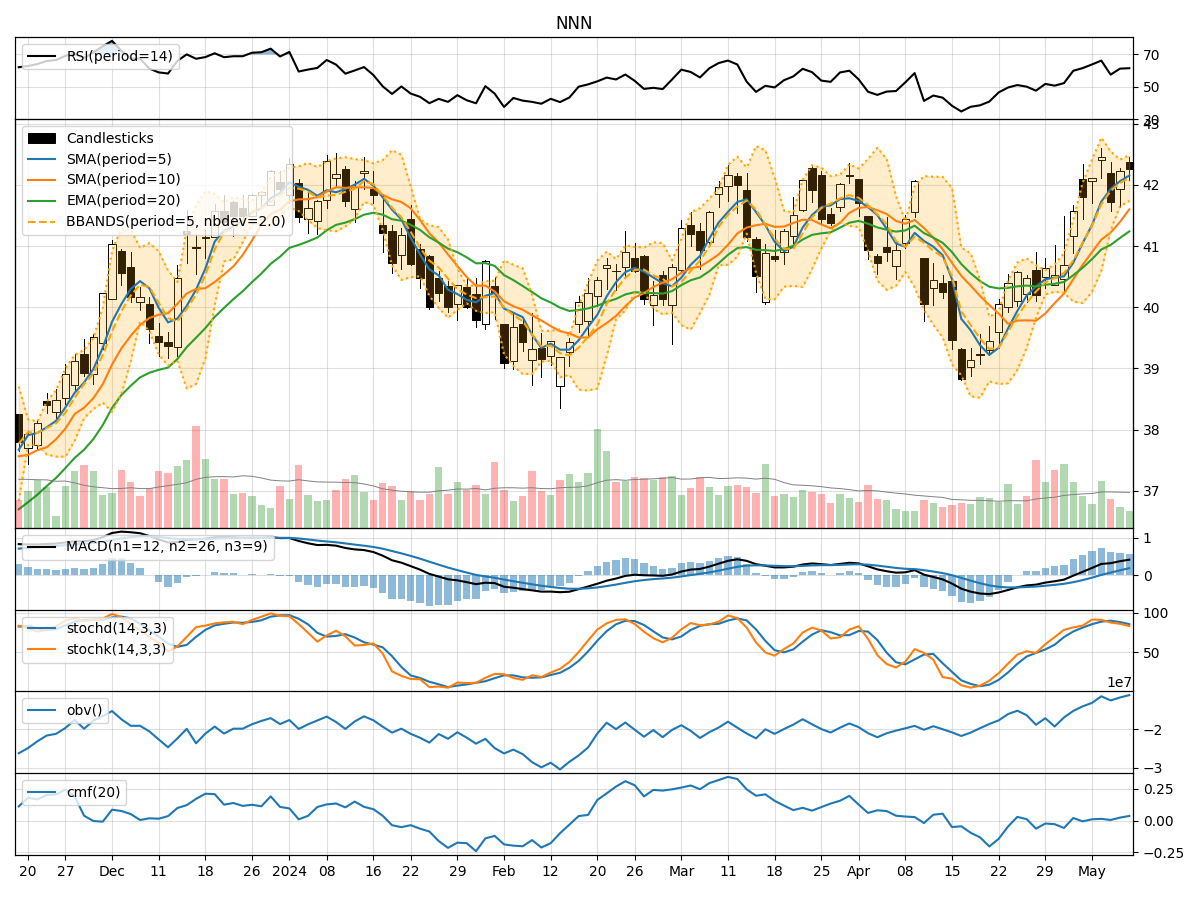
- Moving Averages (MA): The 5-day Moving Average (MA) has been consistently above the Simple Moving Average (SMA) and Exponential Moving Average (EMA), indicating a bullish trend.
- MACD: The MACD line has been above the signal line, with both lines showing an upward trend, suggesting positive momentum.
- RSI: The Relative Strength Index (RSI) has been fluctuating but generally staying within the neutral to overbought territory, indicating mixed sentiment.
Momentum Analysis:
- Stochastic Oscillator: The Stochastic Oscillator has been gradually decreasing, moving from overbought to oversold levels, signaling a potential reversal.
- Williams %R: The Williams %R has been hovering in the oversold territory, indicating a possible buying opportunity.
Volatility Analysis:
- Bollinger Bands (BB): The Bollinger Bands have been narrowing, suggesting decreasing volatility and a potential breakout in the near future.
- Average True Range (ATR): The ATR has been relatively stable, indicating consistent price movements.
Volume Analysis:
- On-Balance Volume (OBV): The OBV has shown an overall increase, reflecting accumulation by investors.
- Chaikin Money Flow (CMF): The CMF has been positive, indicating buying pressure in the market.
Key Observations:
- The trend indicators suggest a bullish sentiment, supported by the moving averages and MACD.
- Momentum indicators show a potential reversal in the short term, as the Stochastic Oscillator and Williams %R indicate oversold conditions.
- Volatility indicators point towards a potential breakout, with the Bollinger Bands narrowing.
- Volume indicators reflect positive accumulation and buying pressure in the market.
Conclusion:
Based on the analysis of the technical indicators, the next few days for NNN stock price movement are likely to be upward with a potential bullish bias. Traders may consider entering long positions based on the bullish trend, positive momentum, decreasing volatility, and strong buying pressure indicated by the volume indicators. However, it is essential to monitor the Stochastic Oscillator and Williams %R for potential reversals and adjust trading strategies accordingly.