Technical Analysis of NOAH 2024-05-10
Overview:
In analyzing the technical indicators for NOAH stock over the last 5 days, we will delve into the trend, momentum, volatility, and volume indicators to provide a comprehensive outlook on the possible future stock price movement. By examining these key indicators, we aim to offer valuable insights and predictions for potential price trends in the coming days.
Trend Analysis:
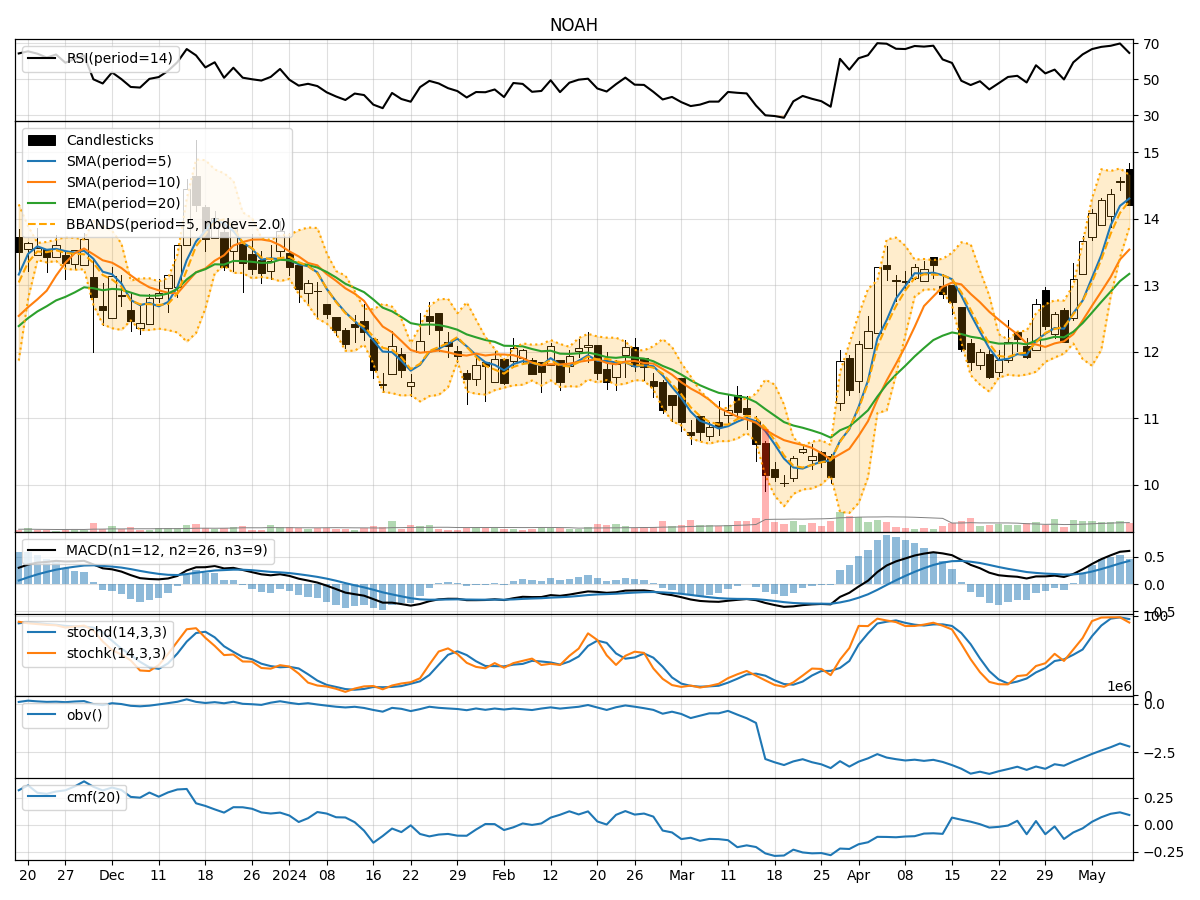
- Moving Averages (MA): The 5-day Moving Average (MA) has been consistently trending upwards, indicating a positive momentum in the stock price.
- MACD: The Moving Average Convergence Divergence (MACD) has shown an increasing trend, with the MACD line consistently above the signal line, suggesting a bullish momentum.
- RSI: The Relative Strength Index (RSI) has been fluctuating but generally staying within the overbought territory, indicating strong buying pressure.
Momentum Analysis:
- Stochastic Oscillator: The Stochastic Oscillator has been in the overbought zone, suggesting a potential reversal or consolidation in the stock price.
- Williams %R: The Williams %R indicator has been in the oversold territory, indicating a possible buying opportunity.
Volatility Analysis:
- Bollinger Bands: The Bollinger Bands have shown a narrowing of the bands, indicating decreasing volatility and a potential period of consolidation.
- Average True Range (ATR): The ATR has been relatively stable, suggesting a lack of significant price fluctuations.
Volume Analysis:
- On-Balance Volume (OBV): The OBV indicator has shown a slight decrease, indicating a divergence between price and volume, which could signal a potential trend reversal.
- Chaikin Money Flow (CMF): The CMF has been positive, indicating buying pressure in the stock.
Conclusion:
Based on the analysis of the technical indicators, the stock price of NOAH is likely to experience further upward movement in the coming days. The bullish trend indicated by the moving averages and MACD, coupled with the overbought conditions in the RSI, suggests that buyers are in control of the market. However, caution is advised as the Stochastic Oscillator is in the overbought zone, indicating a potential reversal. Overall, the consolidation phase indicated by the Bollinger Bands and stable ATR may precede a continued bullish trend in the near future.
In conclusion, the outlook for NOAH stock is bullish with a potential for further price appreciation in the upcoming trading sessions. Traders and investors should closely monitor the Stochastic Oscillator for signs of a reversal and consider taking profits at key resistance levels.