Technical Analysis of NOG 2024-05-10
Overview:
In analyzing the technical indicators for NOG over the last 5 days, we will delve into the trend, momentum, volatility, and volume indicators to provide a comprehensive outlook on the possible stock price movement in the coming days. By examining these key indicators, we aim to offer valuable insights and predictions for potential investors.
Trend Indicators:
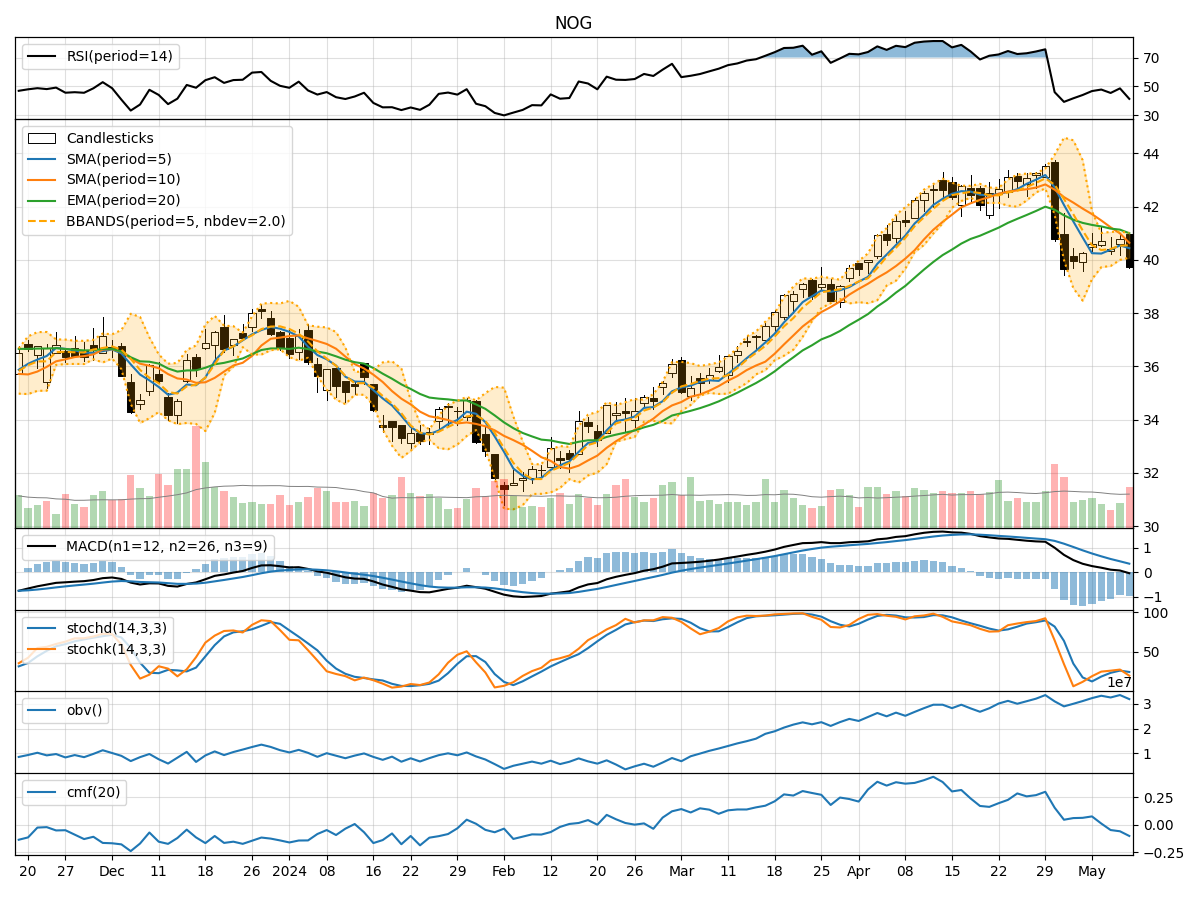
- Moving Averages (MA): The 5-day MA has been fluctuating around the closing prices, indicating short-term price trends. The Simple Moving Average (SMA) and Exponential Moving Average (EMA) show a downward trend, suggesting a bearish sentiment.
- MACD: The MACD line has been consistently below the signal line, indicating a bearish trend in the stock price momentum.
- MACD Histogram: The MACD Histogram has been negative, further confirming the bearish momentum in the stock.
Momentum Indicators:
- RSI: The Relative Strength Index (RSI) has been hovering around the 40-50 range, indicating a neutral sentiment with no clear overbought or oversold conditions.
- Stochastic Oscillator: Both %K and %D lines of the Stochastic Oscillator are below 50, suggesting a bearish momentum in the stock.
- Williams %R: The Williams %R is in the oversold territory, indicating a potential reversal or bounce in the stock price.
Volatility Indicators:
- Bollinger Bands: The Bollinger Bands are narrowing, indicating decreasing volatility in the stock price. The bands are currently close to the lower band, suggesting a potential oversold condition.
- Bollinger %B: The %B indicator is near 0, indicating that the stock price is trading close to the lower Bollinger Band.
Volume Indicators:
- On-Balance Volume (OBV): The OBV has been declining, indicating that selling pressure has been dominant in the stock.
- Chaikin Money Flow (CMF): The CMF is negative, suggesting that money is flowing out of the stock.
Conclusion:
Based on the analysis of the technical indicators, the overall outlook for NOG in the next few days is bearish. The trend indicators show a downward trend, supported by the bearish momentum indicators and decreasing volatility. The volume indicators also confirm the bearish sentiment with declining OBV and negative CMF.
Recommendation:
Considering the bearish signals from the technical indicators, investors should exercise caution when trading NOG in the coming days. It is advisable to wait for a potential reversal confirmation or a significant shift in the technical indicators before considering any long positions. Short-term traders may find opportunities to capitalize on potential downside movements in the stock price.
Disclaimer:
This analysis is based solely on technical indicators and historical data, and it is essential to consider other fundamental factors and market dynamics before making any investment decisions. It is recommended to conduct thorough research or consult with a financial advisor to align your investment strategy with your financial goals and risk tolerance level.