Technical Analysis of NOW 2024-05-10
Overview:
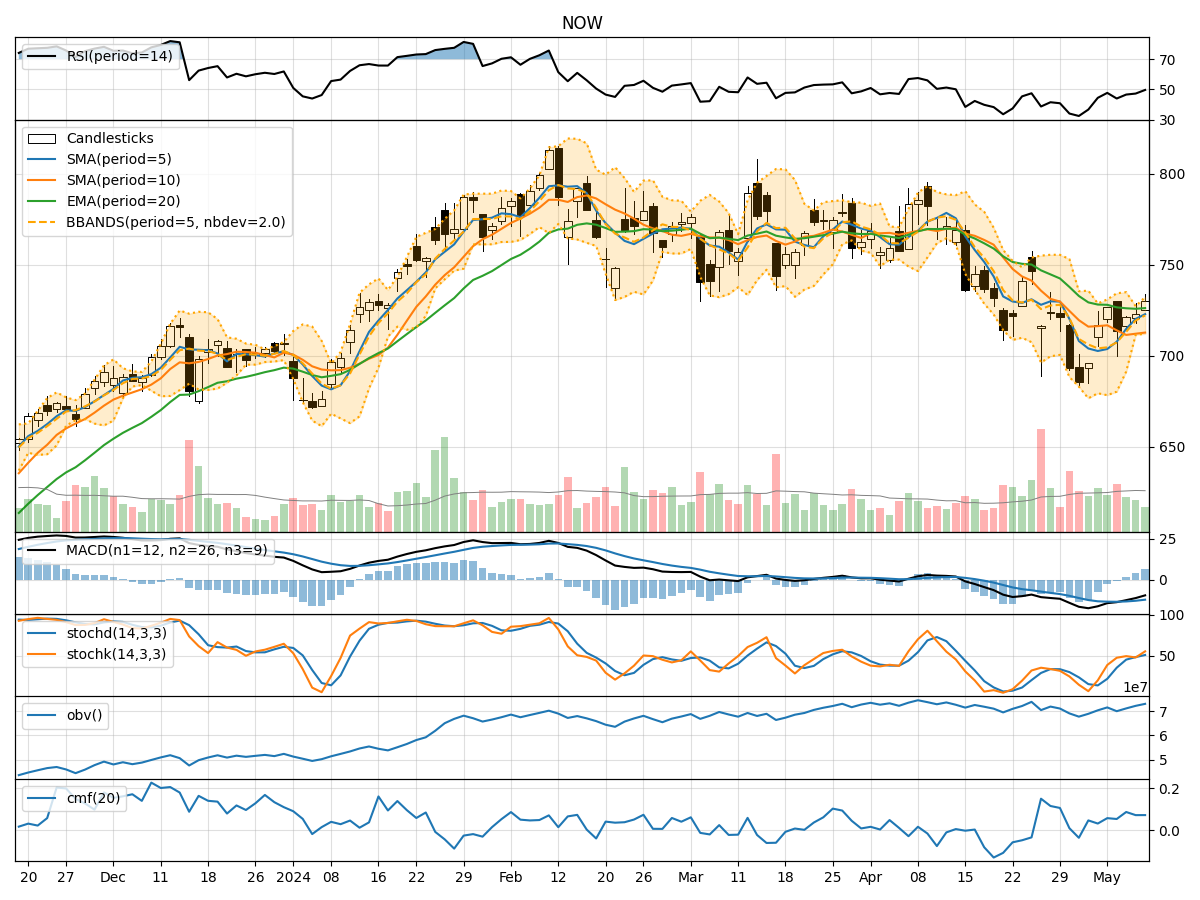
In analyzing the technical indicators for NOW stock over the last 5 days, we will delve into the trend, momentum, volatility, and volume indicators to provide a comprehensive outlook on the possible stock price movement in the coming days. By examining these key indicators, we aim to offer valuable insights and predictions for potential investors.
Trend Analysis:
- Moving Averages (MA): The 5-day Moving Average (MA) has been showing an upward trend, indicating a positive momentum in the stock price.
- MACD: The Moving Average Convergence Divergence (MACD) has been consistently increasing, suggesting a bullish trend in the stock.
Momentum Analysis:
- RSI: The Relative Strength Index (RSI) has been gradually increasing, indicating a strengthening momentum in the stock.
- Stochastic Oscillator: Both %K and %D values have been rising, signaling a bullish momentum in the stock price.
Volatility Analysis:
- Bollinger Bands (BB): The Bollinger Bands have been widening, indicating increased volatility in the stock price.
Volume Analysis:
- On-Balance Volume (OBV): The OBV has been steadily increasing, suggesting a positive accumulation of the stock.
- Chaikin Money Flow (CMF): The CMF has been on the rise, indicating a bullish trend in the stock price.
Key Observations:
- The stock has shown positive trends in moving averages and momentum indicators, indicating a bullish sentiment.
- Volatility has increased, which could lead to larger price swings in the coming days.
- Volume indicators suggest a positive accumulation of the stock by investors.
Conclusion:
Based on the analysis of the technical indicators, the stock is likely to continue its upward momentum in the next few days. The positive trends in moving averages, momentum indicators, and volume accumulation point towards a bullish outlook. However, investors should be cautious of the increased volatility, which could lead to sharp price movements. Overall, the technical analysis suggests a bullish view for the next few days.