Technical Analysis of NSA 2024-05-10
Overview:
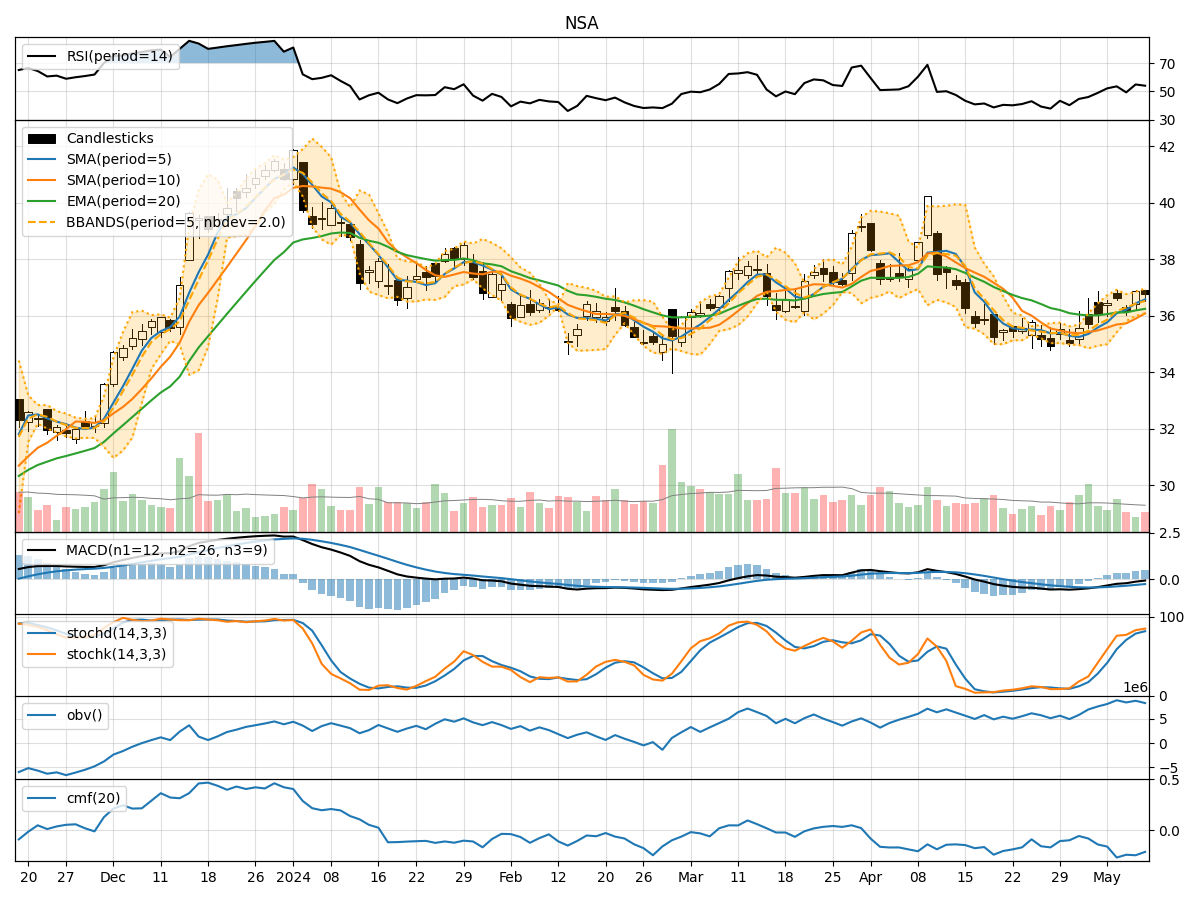
In the last 5 trading days, NSA stock has shown mixed signals across various technical indicators. The stock price has been fluctuating within a certain range, indicating indecision in the market. By analyzing trend, momentum, volatility, and volume indicators, we can gain insights into the potential future price movement of NSA stock.
Trend Indicators:
- Moving averages (MA) show a slight uptrend, with the 5-day MA consistently above the 10-day simple moving average (SMA).
- Exponential moving average (EMA) has been relatively stable, indicating a potential consolidation phase.
- MACD is negative but showing signs of convergence, suggesting a possible shift in momentum.
Momentum Indicators:
- Relative Strength Index (RSI) is hovering around the neutral zone, indicating a lack of strong buying or selling pressure.
- Stochastic oscillators are in the overbought region, suggesting a potential reversal or consolidation.
- Williams %R is also in the oversold region, indicating a possible buying opportunity.
Volatility Indicators:
- Bollinger Bands are narrowing, indicating decreasing volatility and a potential breakout in the near future.
- Bollinger Band %B is relatively low, suggesting a possible consolidation phase.
- Volatility indicators are showing signs of stabilization, which could lead to a period of sideways movement.
Volume Indicators:
- On-Balance Volume (OBV) has been relatively flat, indicating a balance between buying and selling pressure.
- Chaikin Money Flow (CMF) is negative, suggesting a slight outflow of money from the stock.
Key Observations:
- The stock is currently in a consolidation phase, with mixed signals from different indicators.
- Indicators like MACD and Stochastic oscillators hint at a potential reversal or consolidation.
- Volatility is decreasing, indicating a period of stability in the stock price.
- Volume indicators suggest a lack of significant buying or selling pressure.
Conclusion:
Based on the analysis of technical indicators, NSA stock is likely to experience a period of consolidation in the near term. The lack of clear direction from trend and momentum indicators, coupled with decreasing volatility and flat volume indicators, points towards a sideways movement. Traders should exercise caution and wait for clearer signals before making significant trading decisions.