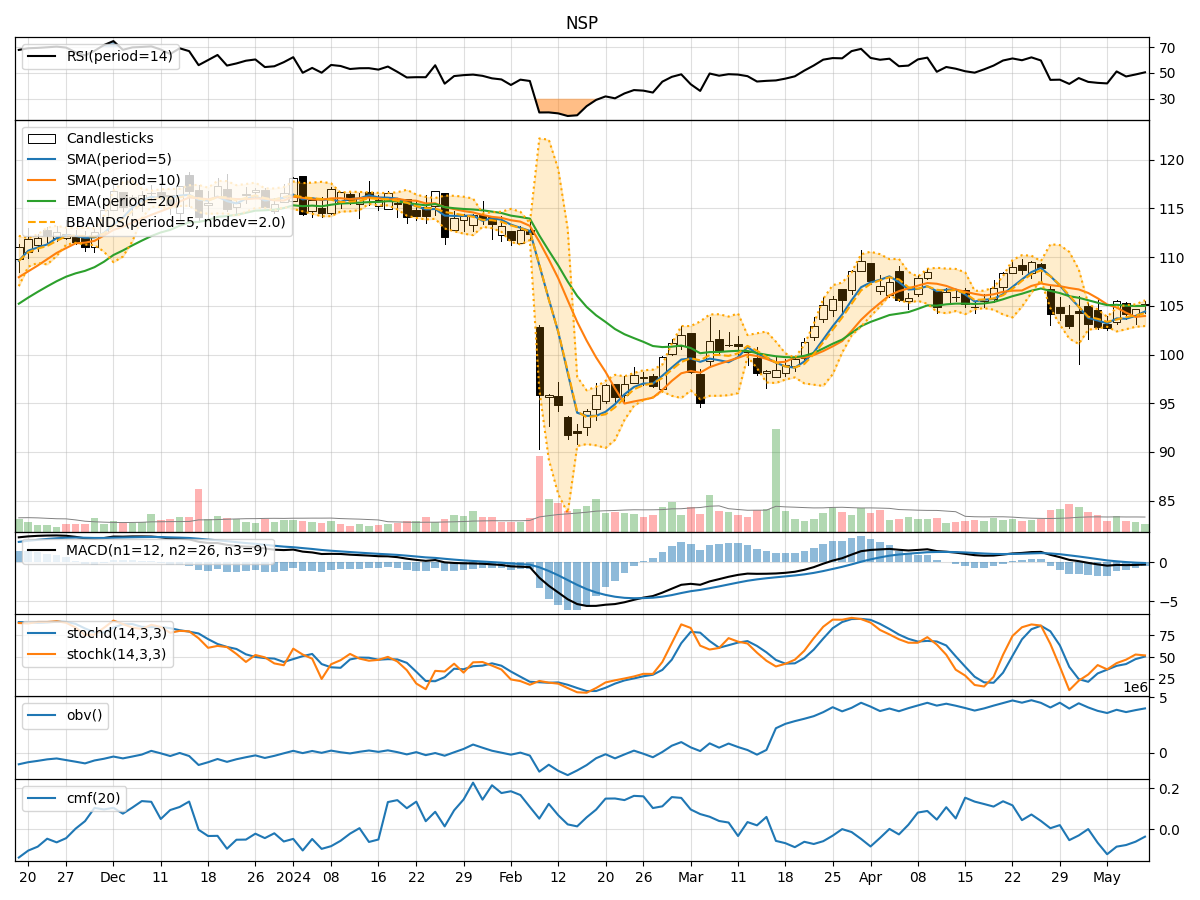
Technical Analysis of NSP 2024-05-10
Overview:
In analyzing the technical indicators for NSP over the last 5 days, we will delve into the trend, momentum, volatility, and volume indicators to provide a comprehensive outlook on the possible stock price movement in the coming days.
Trend Analysis:
- Moving Averages (MA): The 5-day MA has been below the closing prices, indicating a short-term downtrend.
- MACD: The MACD line has been consistently below the signal line, suggesting a bearish momentum.
- RSI: The RSI has been hovering around the mid-level, indicating a neutral sentiment.
Momentum Analysis:
- Stochastic Oscillator: The Stochastic Oscillator has been fluctuating around the mid-level, reflecting indecision in momentum.
- Williams %R: The Williams %R is also near the oversold territory, signaling a potential reversal.
Volatility Analysis:
- Bollinger Bands (BB): The stock price has been trading within the Bollinger Bands, indicating a period of consolidation.
- BB Width: The narrowing of the BB width suggests decreasing volatility.
Volume Analysis:
- On-Balance Volume (OBV): The OBV has been relatively stable, indicating a balance between buying and selling pressure.
- Chaikin Money Flow (CMF): The CMF has been negative, suggesting outflow of money from the stock.
Key Observations:
- The stock is currently in a consolidation phase with no clear trend direction.
- Momentum indicators show mixed signals, reflecting uncertainty in market sentiment.
- Volatility has been decreasing, indicating a potential breakout in the near future.
- Volume indicators suggest a balance between buyers and sellers.
Conclusion:
Based on the analysis of technical indicators, the stock is likely to continue trading sideways in the near term. The lack of a clear trend direction, mixed momentum signals, and stable volume indicate a period of consolidation. Traders should exercise caution and wait for a decisive breakout above or below the current range before taking any significant positions.
Recommendation:
- Short Term: Consider range-bound trading strategies until a clear trend emerges.
- Long Term: Monitor for a breakout above or below the current consolidation range for potential trend confirmation.
Overall Assessment:
The stock is currently in a sideways consolidation phase with neutral to slightly bearish bias. Traders should remain patient and wait for a clearer signal before making any significant trading decisions.