Technical Analysis of NU 2024-07-18
Overview
In analyzing the recent technical data for NU, we can derive insights into potential price movements over the next few days. The data spans five trading days, revealing trends in price, volume, momentum, and volatility indicators. By examining these indicators, we can formulate a comprehensive outlook on the stock's potential trajectory.
Trend Indicators
-
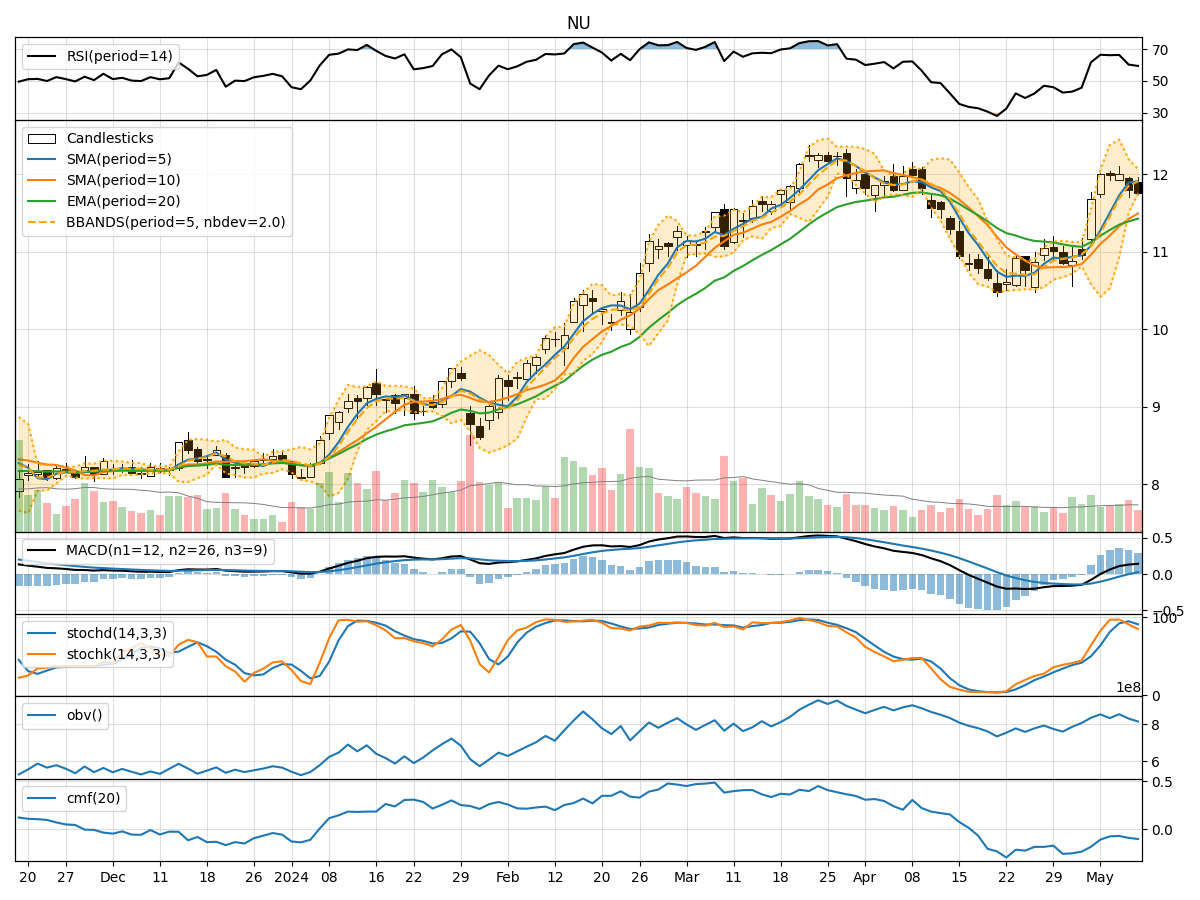
Moving Averages (MA): The 5-day moving average (MA) is currently at 13.332, while the 10-day simple moving average (SMA) is at 13.193. The fact that the 5-day MA is above the 10-day SMA suggests a bullish trend in the short term. However, the recent decline in the closing price from 13.58 on July 16 to 13.11 on July 18 indicates a potential reversal or consolidation phase.
-
MACD: The MACD values have shown a decreasing trend, with the latest value at 0.376312. The MACD histogram has also decreased, indicating a weakening momentum. This could suggest a potential bearish divergence, where the price may struggle to maintain upward momentum.
Momentum Indicators
-
Relative Strength Index (RSI): The RSI has dropped from 69.56 on July 16 to 58.38 on July 18, moving closer to the neutral zone (50). An RSI above 70 typically indicates overbought conditions, while below 30 indicates oversold conditions. The current RSI suggests that NU is moving towards a more balanced state, indicating a potential consolidation phase.
-
Stochastic Oscillator: The Stochastic K and D values have also decreased, with the latest K at 78.28 and D at 84.61. This indicates that the stock is still in the overbought territory but is showing signs of weakening momentum. A crossover below the 80 level could signal a bearish reversal.
-
Williams %R: The Williams %R has moved from -3.87 to -34.19, indicating a shift from overbought conditions towards a more neutral stance. This further supports the idea of a potential consolidation or pullback.
Volatility Indicators
-
Bollinger Bands: The current Bollinger Bands show a middle band (SMA) at 13.332 with upper and lower bands at 13.653845 and 13.010155, respectively. The price is currently closer to the lower band, suggesting that the stock may be experiencing increased volatility and could be approaching a support level.
-
Bollinger Band Width: The width of the bands has narrowed, indicating a potential decrease in volatility. This could suggest that the stock is entering a consolidation phase before a breakout or breakdown.
Volume Indicators
-
On-Balance Volume (OBV): The OBV has shown a decline from 156,695,612 on July 12 to 105,015,922 on July 18. This indicates that the volume is decreasing as the price is falling, which is a bearish sign. A declining OBV suggests that selling pressure is increasing, which could lead to further downward movement.
-
Chaikin Money Flow (CMF): The CMF has remained relatively stable, with a slight increase to 0.314317. This indicates that there is still some buying pressure, but it is not strong enough to counteract the bearish signals from the OBV.
Key Observations and Conclusions
-
Trend Analysis: The short-term trend appears to be bearish due to the recent price decline and weakening MACD. The stock may be entering a consolidation phase as it approaches key support levels.
-
Momentum Analysis: The RSI and Stochastic indicators suggest that NU is moving towards a more neutral state, indicating potential sideways movement in the near term. The Williams %R also supports this view.
-
Volatility Analysis: The narrowing Bollinger Bands indicate a potential decrease in volatility, suggesting that the stock may be preparing for a significant price movement, either up or down.
-
Volume Analysis: The declining OBV indicates increasing selling pressure, which could lead to further downward movement in the stock price.
Conclusion
Based on the analysis of the technical indicators, the next few days for NU may see sideways movement or a potential downward trend as the stock consolidates. The weakening momentum and increasing selling pressure suggest that traders should be cautious. A break below the recent support level could lead to further declines, while a strong reversal above the recent highs could indicate a return to a bullish trend. Therefore, it is essential to monitor these indicators closely for any signs of a reversal or continuation of the current trend.