Technical Analysis of NVGS 2024-05-10
Overview:
In analyzing the technical indicators for NVGS over the last 5 days, we will delve into the trend, momentum, volatility, and volume indicators to provide a comprehensive outlook on the possible stock price movement. By examining these key factors, we aim to offer valuable insights and predictions for the upcoming days.
Trend Indicators:
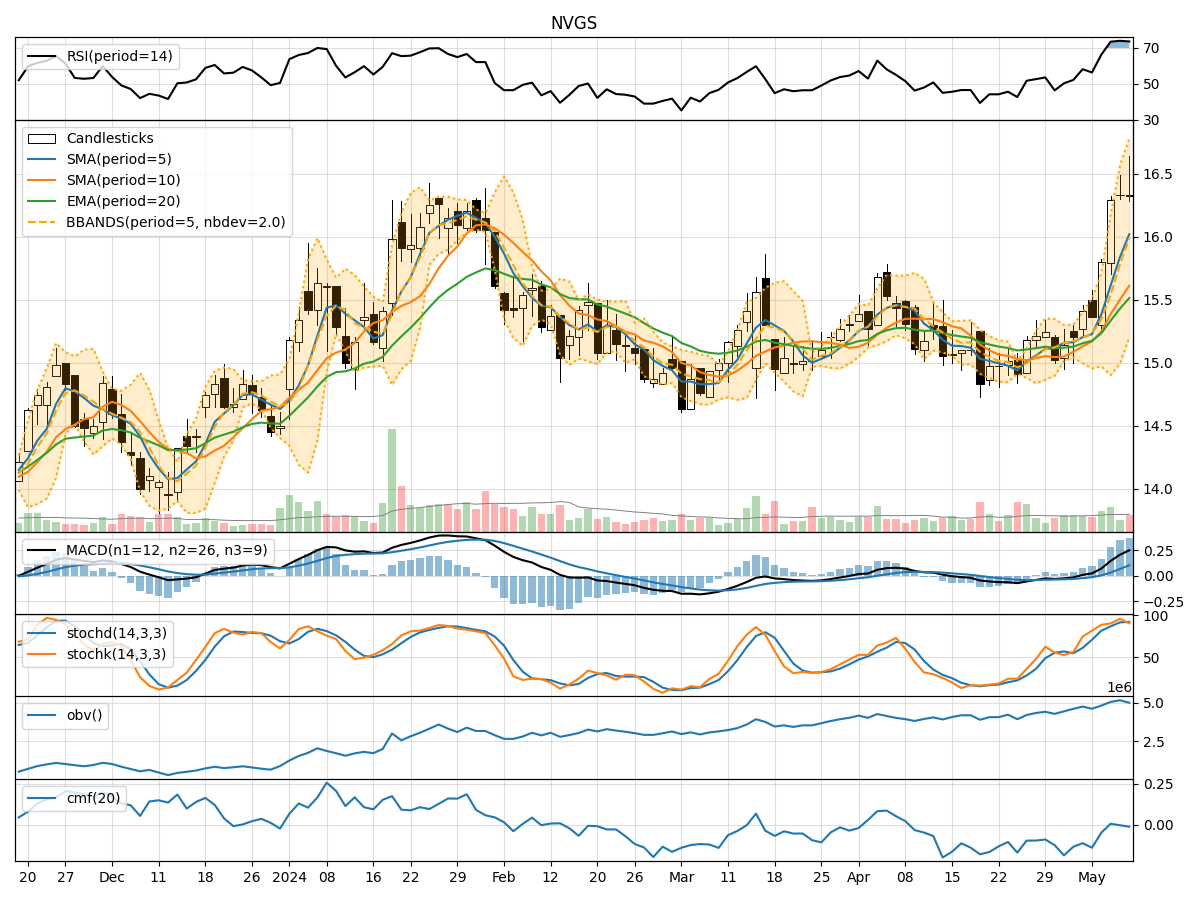
- Moving Averages (MA): The 5-day MA has been consistently rising, indicating a bullish trend in the short term.
- MACD: The MACD line has been above the signal line, suggesting positive momentum.
- RSI: The RSI has been trending upwards, reflecting increasing buying pressure.
Key Observation: The trend indicators point towards a bullish sentiment in the market.
Momentum Indicators:
- Stochastic Oscillator: Both %K and %D have been in the overbought territory, signaling a potential reversal.
- Williams %R: The indicator has been in the oversold region, hinting at a possible buying opportunity.
Key Observation: Momentum indicators suggest a mixed sentiment with a potential for a reversal in the short term.
Volatility Indicators:
- Bollinger Bands: The bands have been widening, indicating increased volatility in the stock.
- BB% (Bollinger Band %B): The %B has been fluctuating, reflecting the stock's price relative to the bands.
Key Observation: Volatility indicators point towards increased volatility in the stock.
Volume Indicators:
- On-Balance Volume (OBV): The OBV has shown mixed movements, suggesting indecision among investors.
- Chaikin Money Flow (CMF): The CMF has been negative, indicating selling pressure in the stock.
Key Observation: Volume indicators reflect a neutral to bearish sentiment in the market.
Conclusion:
Based on the analysis of the technical indicators, the next few days' possible stock price movement for NVGS could see a mixed outlook. While trend indicators suggest a bullish sentiment, momentum indicators hint at a potential reversal in the short term. Increased volatility and neutral to bearish volume indicators add complexity to the forecast.
Recommendation:
Considering the mixed signals from the technical indicators, investors should exercise caution and closely monitor the stock's price action. It is advisable to wait for confirmation from key support and resistance levels before making any significant trading decisions. Conducting further analysis and staying updated on market developments will be crucial in navigating the potential price movements of NVGS in the coming days.