Technical Analysis of NVR 2024-05-10
Overview:
In analyzing the technical indicators for NVR stock over the last 5 days, we will delve into the trend, momentum, volatility, and volume indicators to provide a comprehensive outlook on the possible stock price movement in the coming days. By examining these key indicators, we aim to offer valuable insights and predictions for informed decision-making.
Trend Analysis:
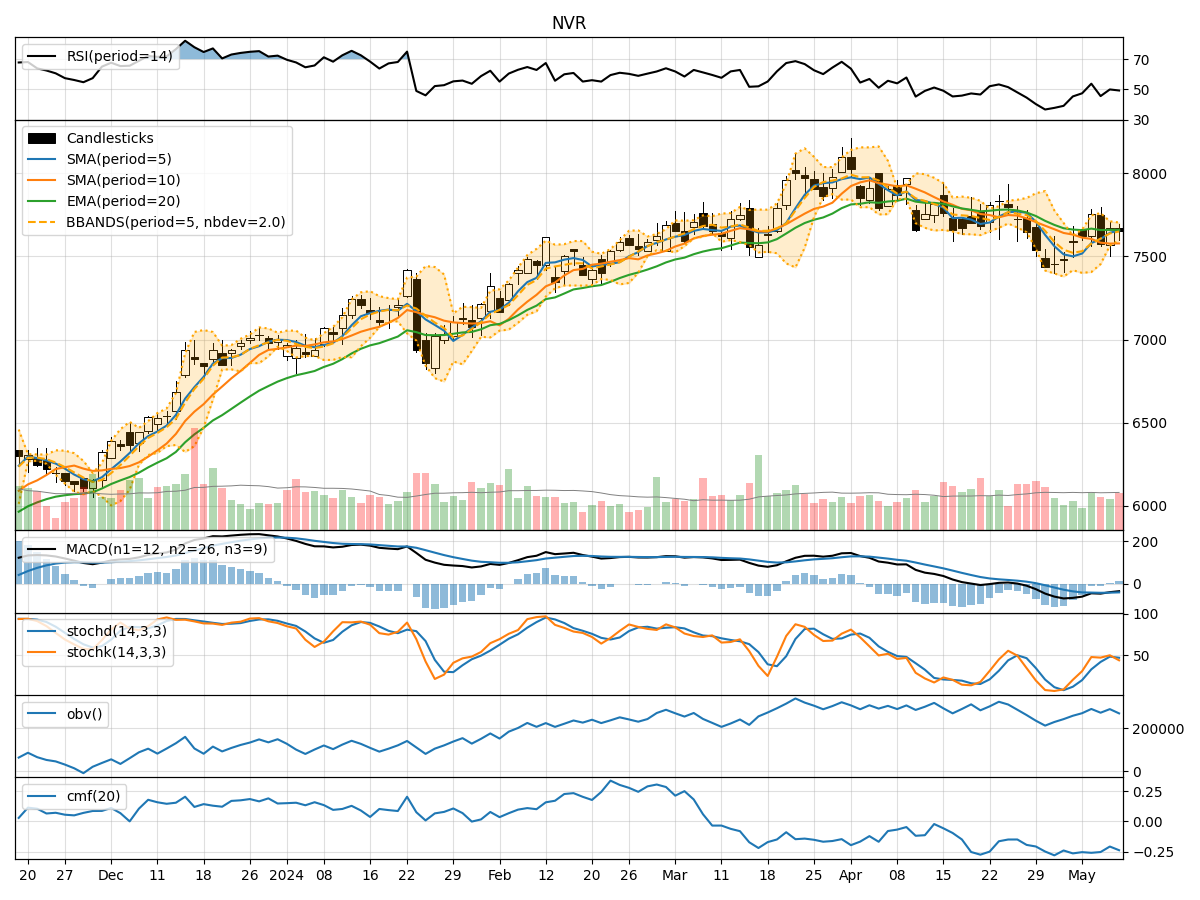
- Moving Averages (MA): The 5-day Moving Average (MA) has been fluctuating around the closing prices, indicating short-term price trends. The Simple Moving Average (SMA) and Exponential Moving Average (EMA) show a slight downward trend, suggesting a potential bearish sentiment.
- MACD: The Moving Average Convergence Divergence (MACD) has been negative, with the MACD line consistently below the signal line. This indicates a bearish momentum in the stock price.
Momentum Analysis:
- RSI: The Relative Strength Index (RSI) has been hovering around the neutral zone, indicating a lack of strong buying or selling pressure.
- Stochastic Oscillator: Both %K and %D lines of the Stochastic Oscillator are below 50, suggesting a bearish momentum.
Volatility Analysis:
- Bollinger Bands (BB): The Bollinger Bands have been narrowing, indicating decreasing volatility in the stock price. This could potentially lead to a period of consolidation.
Volume Analysis:
- On-Balance Volume (OBV): The OBV has been fluctuating, indicating mixed buying and selling pressure.
- Chaikin Money Flow (CMF): The CMF has been negative, suggesting a bearish sentiment in the stock.
Key Observations:
- The trend indicators point towards a bearish sentiment, with moving averages and MACD signaling a potential downward trend.
- Momentum indicators also support a bearish view, with RSI and Stochastic Oscillator indicating a lack of strong buying pressure.
- Volatility is decreasing, as shown by the narrowing Bollinger Bands, which could lead to a period of consolidation.
- Volume indicators reflect mixed buying and selling pressure, with a slightly bearish bias indicated by the CMF.
Conclusion:
Based on the analysis of the technical indicators, the outlook for NVR stock in the next few days is bearish. The trend, momentum, and volume indicators all point towards a potential downward movement in the stock price. Traders and investors should exercise caution and consider short-term selling strategies or wait for a clearer bullish signal before considering long positions.