Technical Analysis of NVST 2024-05-31
Overview:
In analyzing the technical indicators for NVST over the last 5 days, we will delve into the trend, momentum, volatility, and volume indicators to provide a comprehensive outlook on the possible stock price movement in the coming days. By examining these key aspects, we aim to offer valuable insights and predictions for informed decision-making.
Trend Analysis:
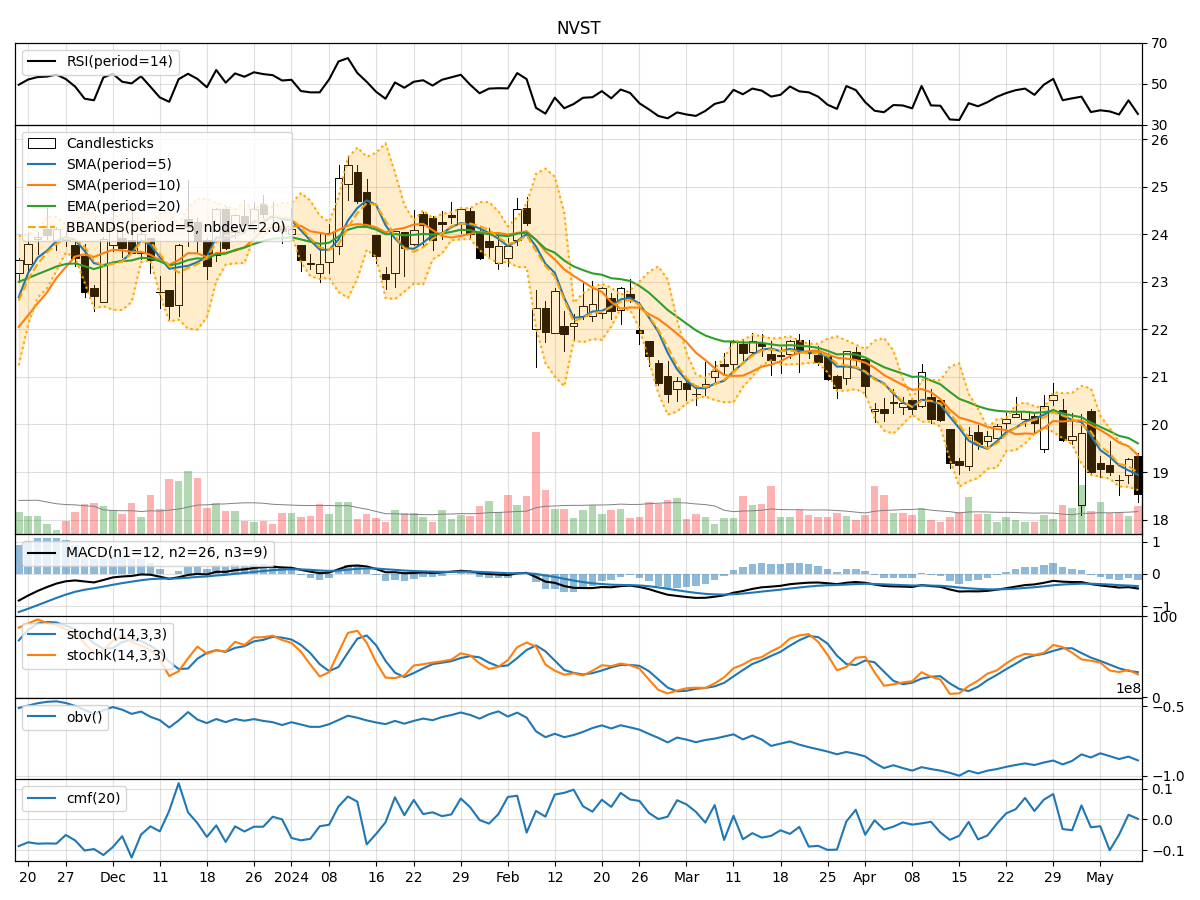
- Moving Averages (MA): The 5-day Moving Average (MA) has been fluctuating around the closing prices, indicating a lack of clear trend direction.
- MACD: The Moving Average Convergence Divergence (MACD) has shown negative values, suggesting a bearish momentum in the short term.
- EMA: The Exponential Moving Average (EMA) has been declining slightly, reflecting a potential weakening trend.
Momentum Analysis:
- RSI: The Relative Strength Index (RSI) has been gradually increasing, indicating a strengthening momentum.
- Stochastic Oscillator: Both %K and %D values have been rising, signaling a bullish momentum.
- Williams %R: The Williams %R is moving towards the oversold region, suggesting a potential reversal in momentum.
Volatility Analysis:
- Bollinger Bands (BB): The Bollinger Bands have widened, indicating increased volatility in the stock price.
- BB%: The %B indicator has been fluctuating within a range, reflecting uncertain price movements.
Volume Analysis:
- On-Balance Volume (OBV): The OBV has shown mixed signals with fluctuations in volume, indicating indecision among market participants.
- Chaikin Money Flow (CMF): The CMF has been positive, suggesting a potential inflow of money into the stock.
Key Observations:
- The trend indicators suggest a lack of clear direction, with a slightly bearish bias.
- Momentum indicators show a mixed picture, with RSI indicating a strengthening momentum while Williams %R signals a potential reversal.
- Volatility has increased, as seen in the widening Bollinger Bands.
- Volume indicators reflect indecision among investors, with OBV showing mixed signals.
Conclusion:
Based on the analysis of the technical indicators, the stock price of NVST is likely to experience further downside movement in the coming days. The bearish signals from the trend indicators and MACD, coupled with the uncertainty in volume and volatility, suggest a potential continuation of the current bearish trend. Traders and investors should exercise caution and consider implementing risk management strategies in their positions.