Technical Analysis of O 2024-05-10
Overview:
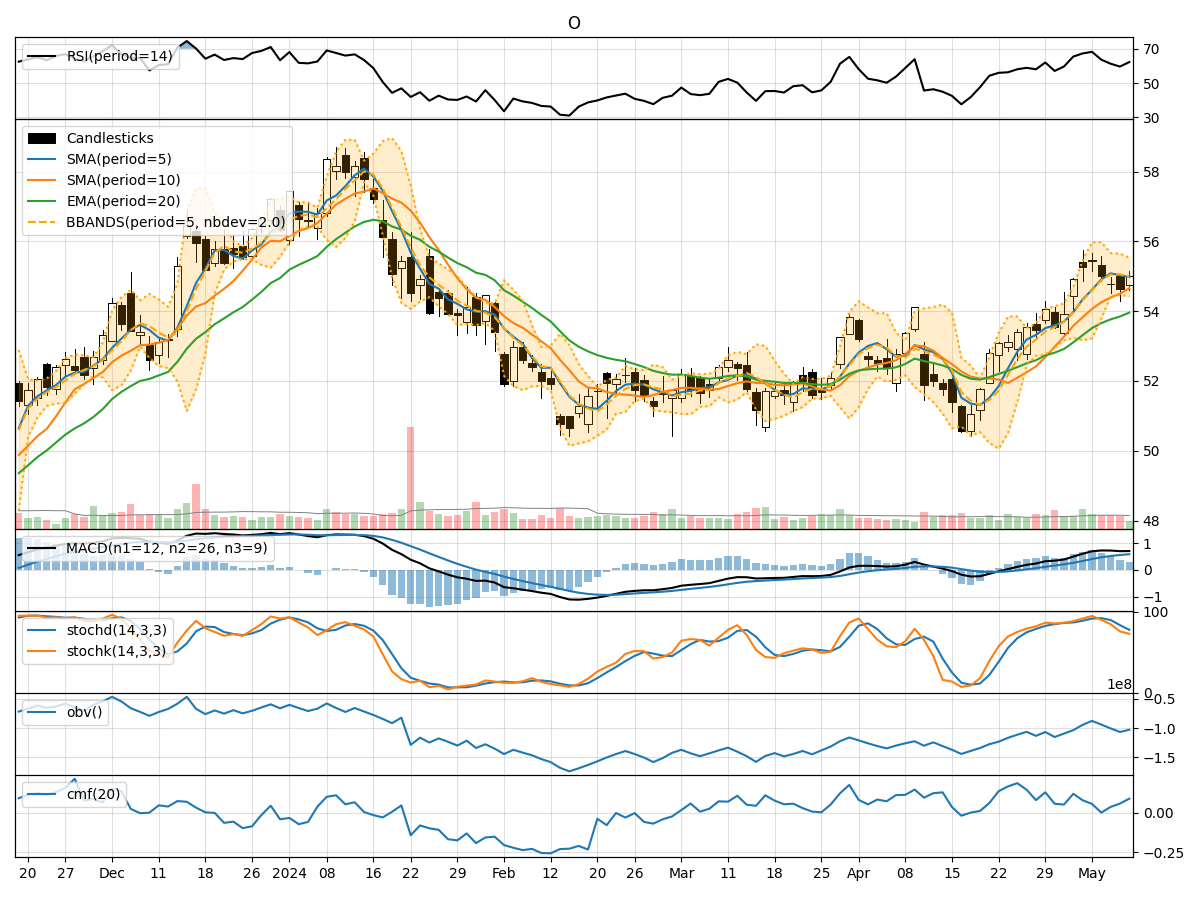
In the last 5 trading days, the stock price has shown some fluctuations but has generally maintained a slightly positive trend. Various technical indicators provide insights into the stock's trend, momentum, volatility, and volume. By analyzing these indicators, we can make informed predictions about the possible future movements of the stock price.
Trend Analysis:
- Moving Averages (MA): The 5-day Moving Average (MA) has been slightly above the Simple Moving Average (SMA) and Exponential Moving Average (EMA), indicating a short-term positive trend.
- MACD: The MACD line has been consistently above the signal line, suggesting bullish momentum in the stock price.
- MACD Histogram: The MACD Histogram has been increasing, indicating strengthening bullish momentum.
Momentum Analysis:
- RSI: The Relative Strength Index (RSI) has been fluctuating but generally staying above 50, indicating a bullish momentum.
- Stochastic Oscillator: Both %K and %D lines of the Stochastic Oscillator have been declining, suggesting a potential reversal in momentum.
- Williams %R: The Williams %R has been fluctuating in the oversold region, indicating a potential buying opportunity.
Volatility Analysis:
- Bollinger Bands (BB): The stock price has been trading within the Bollinger Bands, with the bands narrowing, indicating decreasing volatility.
- Bollinger %B: The %B indicator has been fluctuating around 0.5, suggesting the stock is trading at the mid-range of volatility.
Volume Analysis:
- On-Balance Volume (OBV): The OBV has been fluctuating, indicating mixed buying and selling pressure.
- Chaikin Money Flow (CMF): The CMF has been positive, suggesting a bullish money flow into the stock.
Conclusion:
Based on the analysis of the technical indicators: - Trend: The stock is in an upward trend supported by the moving averages and MACD. - Momentum: The momentum is mixed, with RSI indicating bullish momentum but Stochastic Oscillator showing a potential reversal. - Volatility: The volatility is decreasing, as indicated by the narrowing Bollinger Bands. - Volume: The volume indicators suggest mixed buying and selling pressure.
Future Price Movement Prediction:
Considering the overall analysis, the stock is likely to experience further upward movement in the next few days, supported by the positive trend indicators and bullish momentum. However, traders should closely monitor the Stochastic Oscillator for any potential reversal in momentum. It is advisable to set stop-loss levels to manage risk effectively.