Technical Analysis of OBDC 2024-05-10
Overview:
In analyzing the technical indicators for OBDC stock over the last 5 days, we will delve into the trend, momentum, volatility, and volume indicators to provide a comprehensive outlook on the possible stock price movement in the coming days. By examining these key indicators, we aim to offer valuable insights and predictions to guide your investment decisions.
Trend Analysis:
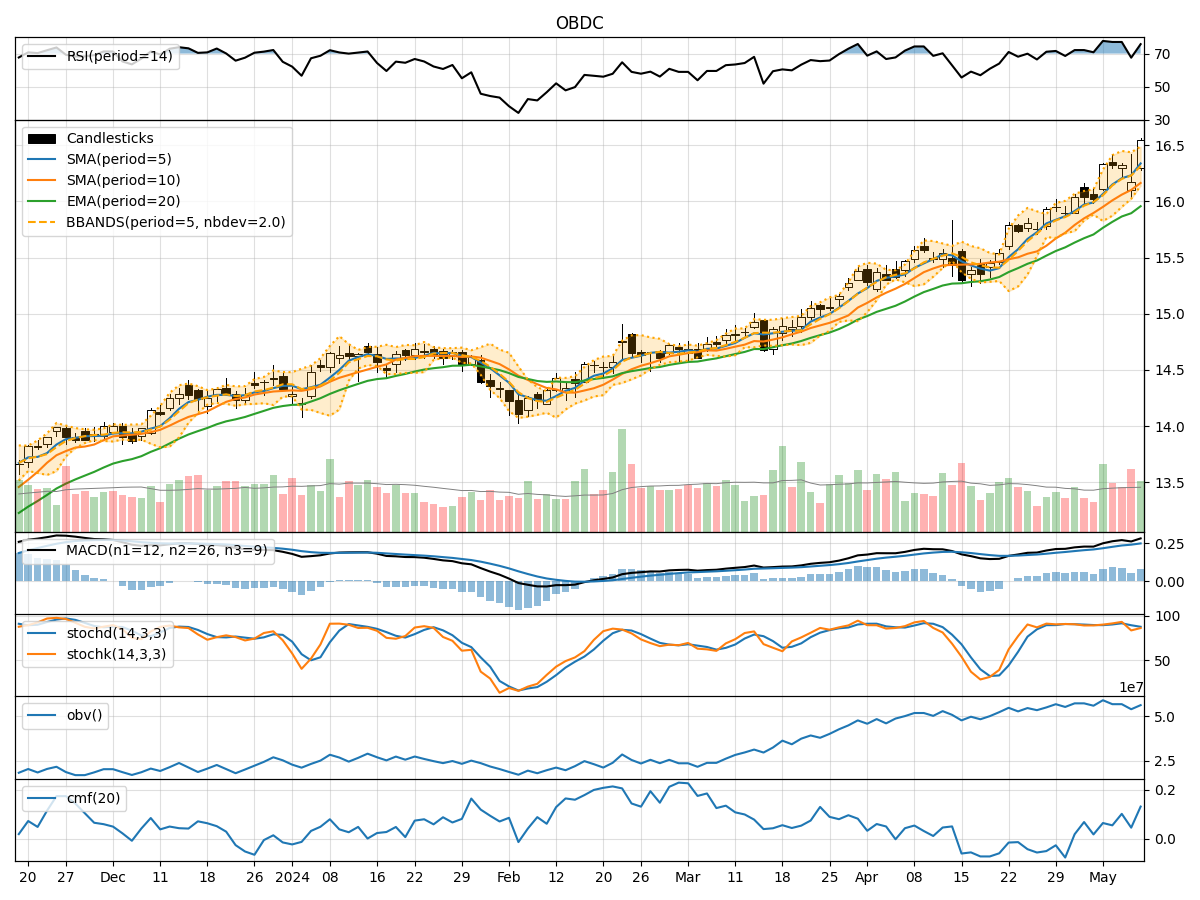
- Moving Averages (MA): The 5-day Moving Average (MA) has been consistently above the Simple Moving Average (SMA) and Exponential Moving Average (EMA), indicating a bullish trend.
- MACD: The MACD line has been above the signal line, with both lines showing an upward trend, suggesting bullish momentum.
Momentum Analysis:
- RSI: The Relative Strength Index (RSI) has been fluctuating but generally staying above 50, indicating bullish momentum.
- Stochastic Oscillator: Both %K and %D have been in the overbought zone, suggesting a potential reversal or consolidation.
Volatility Analysis:
- Bollinger Bands (BB): The stock price has been consistently trading above the middle Bollinger Band (BBM), indicating an upward trend with moderate volatility.
Volume Analysis:
- On-Balance Volume (OBV): The OBV has been fluctuating but showing an overall increase, suggesting accumulation by investors.
- Chaikin Money Flow (CMF): The CMF has been positive, indicating buying pressure in the stock.
Key Observations:
- The trend indicators suggest a strong bullish sentiment with moving averages and MACD supporting an upward trend.
- Momentum indicators show mixed signals with RSI indicating bullish momentum while Stochastic Oscillator signals potential overbought conditions.
- Volatility remains moderate as per Bollinger Bands, indicating a stable price movement.
- Volume indicators reflect positive accumulation and buying pressure in the stock.
Conclusion:
Based on the analysis of technical indicators, the stock is likely to continue its upward movement in the next few days. The bullish trend supported by moving averages and MACD, along with positive volume indicators, suggests a favorable outlook for OBDC stock. However, caution is advised as the Stochastic Oscillator signals potential overbought conditions, which could lead to a short-term pullback or consolidation. Overall, the bullish bias is prominent, and investors may consider maintaining or initiating long positions in OBDC stock.