Technical Analysis of OFG 2024-05-10
Overview:
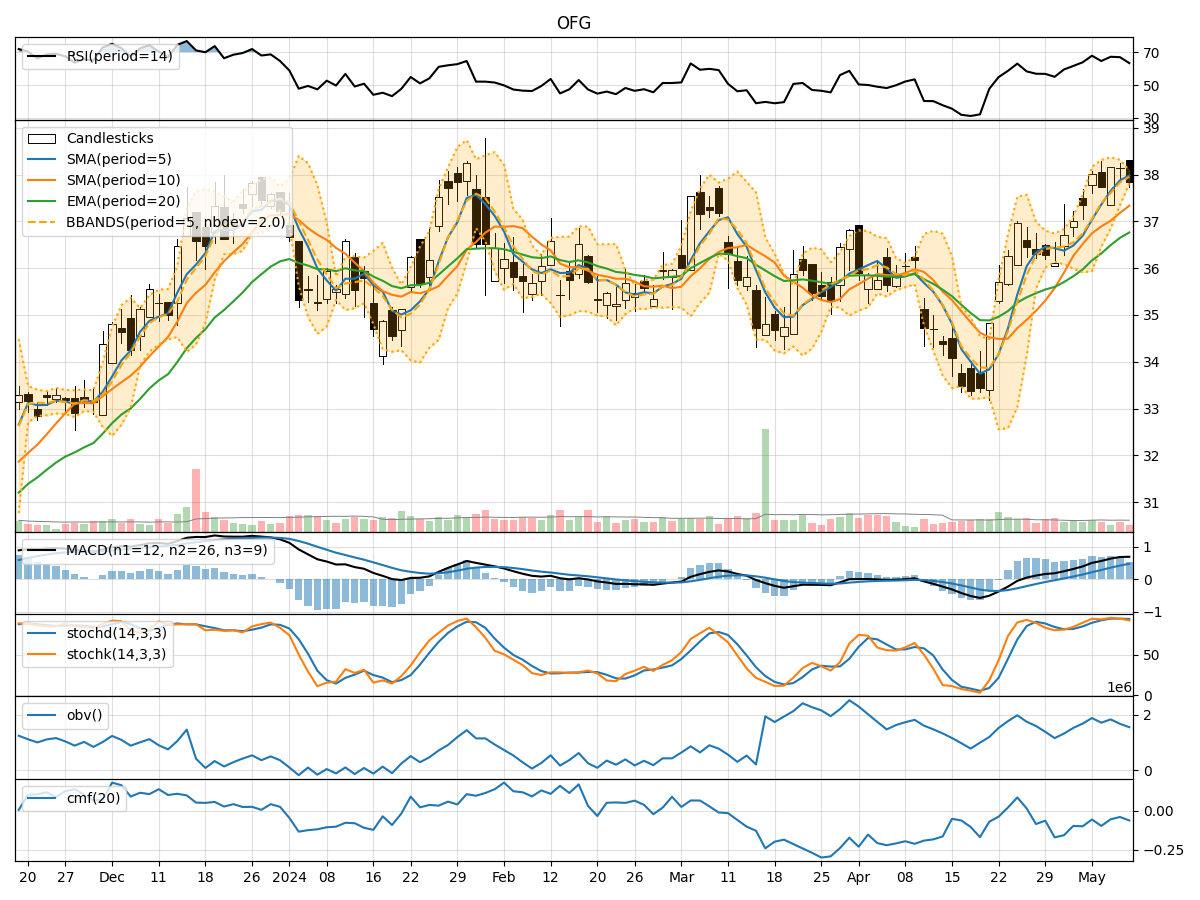
In the last 5 trading days, OFG stock has shown mixed signals across various technical indicators. The stock price has been fluctuating within a certain range, indicating indecision in the market. We will analyze the trend, momentum, volatility, and volume indicators to determine the possible future stock price movement.
Trend Indicators:
- Moving Averages (MA): The 5-day MA has been trending above the 10-day SMA, indicating a short-term bullish trend. However, the EMA(20) is showing a slightly bearish divergence.
- Moving Average Convergence Divergence (MACD): The MACD line has been above the signal line, suggesting a bullish momentum. The MACD Histogram has been decreasing, indicating a potential slowdown in the bullish momentum.
Momentum Indicators:
- Relative Strength Index (RSI): The RSI has been fluctuating around the 50 level, indicating a lack of strong momentum in either direction.
- Stochastic Oscillator: Both %K and %D lines have been in the overbought zone, suggesting a potential reversal or consolidation phase.
- Williams %R: The Williams %R is in the oversold territory, indicating a possible bullish reversal.
Volatility Indicators:
- Bollinger Bands (BB): The stock price has been trading within the Bollinger Bands, suggesting a period of consolidation. The bands are narrowing, indicating decreasing volatility.
- Bollinger %B: The %B indicator is below 1, indicating that the stock price is trading below the lower Bollinger Band, potentially signaling an oversold condition.
Volume Indicators:
- On-Balance Volume (OBV): The OBV has been declining, indicating selling pressure in the stock.
- Chaikin Money Flow (CMF): The CMF has been negative, suggesting that money is flowing out of the stock.
Conclusion:
Based on the analysis of the technical indicators, the stock is currently in a consolidation phase with mixed signals. The trend indicators show a short-term bullish bias, while momentum indicators suggest a lack of strong momentum. Volatility indicators indicate decreasing volatility, and volume indicators show selling pressure.
Possible Future Stock Price Movement:
- Consolidation Phase: The stock is likely to continue trading within a range in the near term.
- Sideways Movement: Expect the stock price to move sideways with limited upside or downside potential.
- Bearish Bias: There is a possibility of a slight downward movement due to selling pressure indicated by volume indicators.
- Caution Advised: Investors should exercise caution and closely monitor the stock for any potential breakout or trend reversal.
Key Takeaway:
The stock is currently in a consolidation phase with a neutral to slightly bearish bias. Investors should wait for clearer signals from the technical indicators before making any significant trading decisions.