Technical Analysis of OGN 2024-05-10
Overview:
In analyzing the technical indicators for OGN over the last 5 days, we will delve into the trend, momentum, volatility, and volume indicators to provide a comprehensive outlook on the possible stock price movement in the coming days.
Trend Analysis:
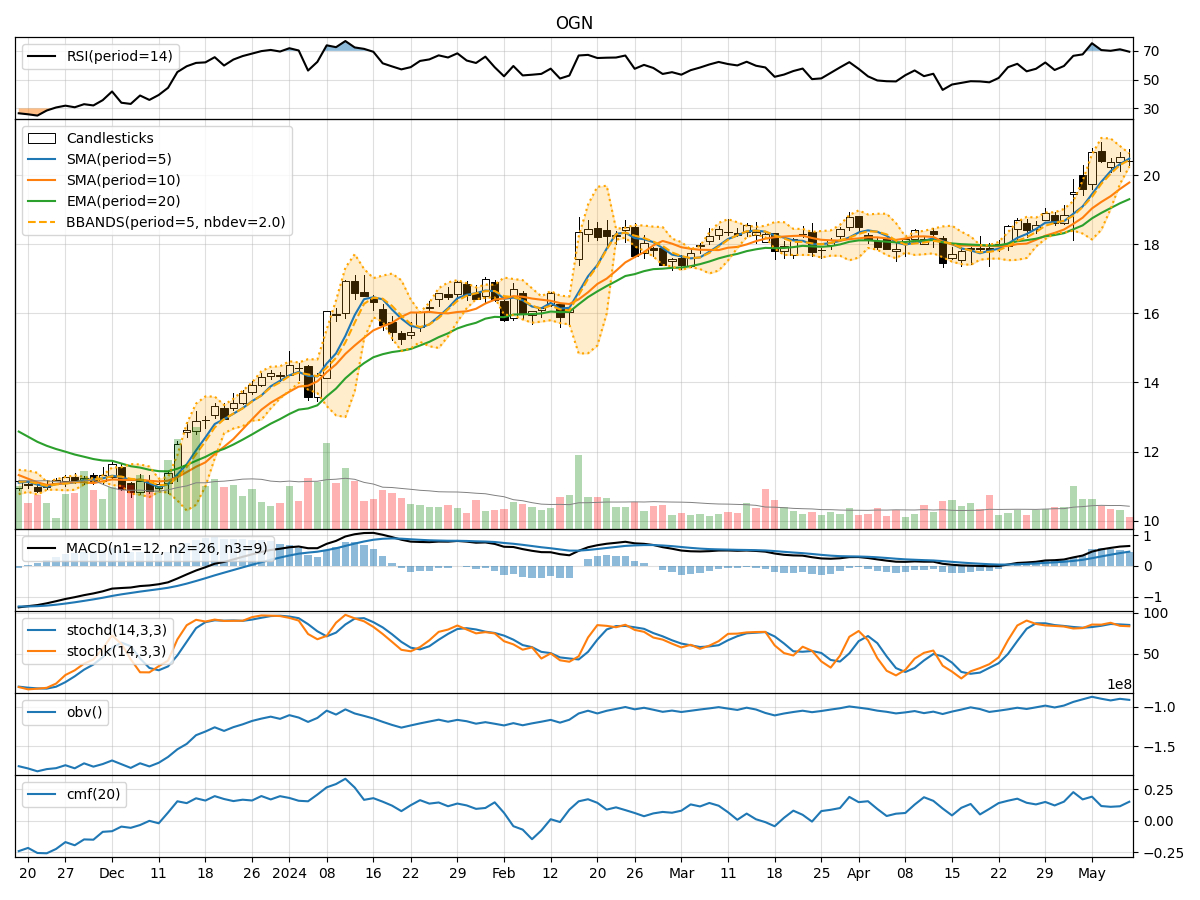
- Moving Averages (MA): The 5-day Moving Average has been consistently above the closing prices, indicating an upward trend. This suggests that the stock price has been trending higher over the past few days.
- MACD: The MACD line has been above the signal line, with both lines showing an upward trajectory. This signals a bullish momentum in the stock price.
Momentum Analysis:
- RSI: The Relative Strength Index (RSI) has been above 70 for the past few days, indicating that the stock is in overbought territory. This could potentially lead to a short-term pullback in the stock price.
- Stochastic Oscillator: Both %K and %D lines of the Stochastic Oscillator have been in the overbought zone, suggesting that the stock price may be due for a correction.
Volatility Analysis:
- Bollinger Bands: The Bollinger Bands have been narrowing, indicating decreasing volatility in the stock price. This could suggest a period of consolidation or sideways movement in the near future.
Volume Analysis:
- On-Balance Volume (OBV): The OBV has shown a slight increase over the past few days, indicating buying pressure in the stock. This could support further upward movement in the stock price.
- Chaikin Money Flow (CMF): The CMF has been positive, indicating that money is flowing into the stock. This supports the bullish outlook for the stock.
Conclusion:
Based on the analysis of the technical indicators, the stock of OGN is currently in an upward trend with bullish momentum. However, the overbought conditions indicated by the RSI and Stochastic Oscillator suggest a potential short-term correction or pullback in the stock price. The narrowing Bollinger Bands indicate a period of consolidation or sideways movement in the near future. Overall, while the stock may experience some short-term volatility, the long-term outlook remains positive. Investors should monitor the indicators closely for any signs of a trend reversal or significant price movement.